
Since last update nothing major has changed in Holuhraun. There have been some changes in Bárðarbunga volcano it self and I am going to cover that later in this article. The magma flow from the craters in Holuhraun remains high at the moment, with latest flow measurements saying that flow of lava is now 100m³/sec. There seems to be uncertain or maybe changes in the flow of lava out of the crater. The volume is now ~1,4 km³. The lava-field has been getting thicker over the past weeks and closest to the craters it is now around 40 meters thick. New estimate of when the eruption might end are now 4 to 15 months.
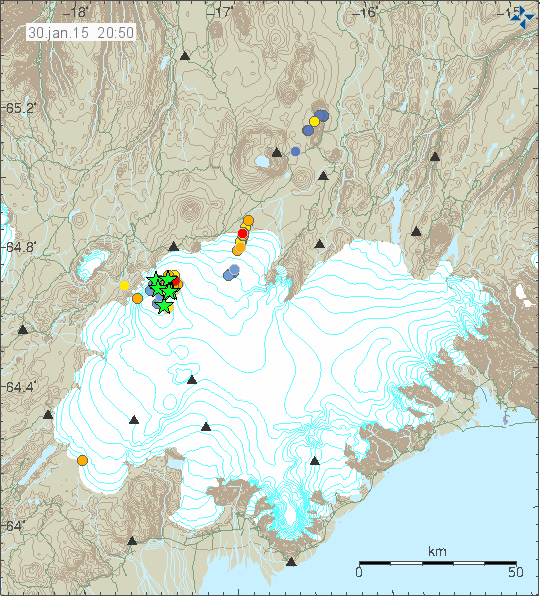
Earthquake activity in Bárðarbunga volcano for the last 48 hours. Copyright of this image belongs to Icelandic Met Office.
Earthquake activity remains high, but it continues to drop at steady rate between weeks. Earthquake activity now also drops between peaks in activity. I still don’t know if a small eruption took place in Bárðarbunga volcano. Nothing has yet been confirmed and it might remain unconfirmed for a long time. I am also seeing small spikes in the harmonic tremor data due to hydrothermal activity in Bárðarbunga volcano (far as I can tell).
If anything major happens I am going to post update about it soon as I can.
Donations: Please remember to donate to support my work or support my work by shopping through Amazon links that I have here. Thanks for the support.
I noted the 100 m3/sec figure was back again, that is what I thought it would be. It is only due to some of the flow going into lava tubes that it is not being seen.
I am interested in the gas cloud analysis, it is exhibiting signs that it is coming from a large deep source. There was speculation some time ago that the composition was changing in a way that showed it was from a limited reservoir that had released much of its gas in the first part of the eruption. That is clearly not the case now.
What’s going on at herðubreið?
Judging by the GPS the plates are on the move again. Hauc has changed direction again and gfum is going SSE. Microplate likeliest cause.
Sunday
01.02.2015 08:18:53 64.659 -17.512 6.6 km 4.4 99.0 2.2 km NNE of Bárðarbunga
Apropos fire fountains at Holuhraun:
http://omarragnarsson.blog.is/blog/omarragnarsson/image/1253732/ New picture by journalist Ómar Ragnarsson
And a new picture by NASA satellites: http://jardvis.hi.is/bardarbunga_holuhraun
If that is a photo taken 2 days ago that is a major change in activity?
Oops no snow,so from last summer.
Ehm … looking again at it, this seems probable ….
snow, in a hot lava field?
Look at the lighting,that is not a winters day,plus no snow even in the far distance.
@Z
http://cdn.rt.com/files/news/36/4e/30/00/holuhraun-1.si.jpg
http://icelandmag.com/sites/default/files/styles/lightbox/public/thumbnails/image/screen_shot_2014-11-04_at_15.21.08.png?itok=LTzbaXrM
https://pbs.twimg.com/media/Bysd_BAIUAEm2XT.jpg
🙂
Ah, I stand corrected!
On 31. 01.15, there were again measured around 2.300 μg/m3 in Höfn. http://ust.is/einstaklingar/loftgaedi/linurit/?station=hofnihornafirdi
Concerning the magmatic production measured in DRE (Dense Rock Equivalent), the Holuhraun eruption has now produced 8x the DRE of the Eyjafjallajökull eruption in 2010 and 5x the DRE of the Grímsvötn eruption in 2011. It correponds to about 10% of the DRE of the Laki eruption in 1783/4. http://www.ruv.is/frett/attfalt-staerra-en-gosid-i-eyjafjallajokli
Actually the DRE is indicating the erupted magmatic products, ie. tephra and lava.
now this looks like tremor to me
http://hraun.vedur.is/ja/drumplot/djk.png
not showing up much in the low frequency, looks like water moving
http://brunnur.vedur.is/myndir/steinn.png
Blue line rising, red line stable and not showing on other stations
Looks like a flood
http://hraun.vedur.is/ja/vatnajokulsvoktun/djk1_trem.gif
But….but,you said it was over?
Regrettably, it is not possible to see, if there is more water than usual in the rivers, because the ice hinders measurements. http://en.vedur.is/#tab=vatnafar
The measuring station next to the volcano, at Upptýppingar, shows practically nothing. http://vmkerfi.vedur.is/vatn/vdv.php?p=0&station_id=222&page_id=342&direct=1 But see the above …
The above refers to Jökulsá á Fjöllum and also to Skjálfandafljót. There is still another smaller river which gets part of its waters from the glacier in question, and this is Svartá. There was today a – small spike – in at the same time: water height, water discarge, water temperature and conductivity. http://vmkerfi.vedur.is/vatn/vdv.php?p=0&station_id=221&page_id=386&direct=1 But on the other hand, compared to eg. the last month, it really was a very small spike – which could indicate heightened hydrothermal activity within the caldera.
whatever it was it seems to be over now, could be people at the station, doubt it because it is so late in the day
Will be interesting to watch the hydro stations to see if anything shows up
never said it was over, said all the data shows it is declining
As Yogi said, it over till it’s over.
This looks like a flood, I would bet from the area in the south east section that had a small eruption at the beginning
Vigorous subglacial hydothermal activity?
Yep, is quite possible, this is the area with the cauldrons, DJK is located in a position to pick this up when other stations wouldn’t
Once heating reaches a tipping point then maybe activity will speed up,cascade effect?
lol, why does everything have to grow for you, these floods happen all the time under these glaciers, this could even be from Grimsvotn and may not even involve BB
Wait and see and then we will know
Volcanic events once started, tend to develop or grow in stature until they reach peak potential,now has this event peaked at the caldera?You made the connection between the signal and the caldera and I was just theorising on what it could mean,also activity will generally be related to the system currently in unrest and saying its related to a nearby system that is not in unrest is not really logical?
This thing could be several different things, what I suggested is one possibility only
I am just saying it makes me laugh that you seem to jump right away to ” this thing is going to blow and we are all going to die”
No no no,that is not what I have ever suggested,calderas all over the world have active shallow magma systems,with associated hydrothermal activity etc and do not progress to full on caldera eruption events.That is why there has not been one in living memory,this system has become active in the caldera and this could progress for many many years without a major eruption or there could be an eruption,the only thing that has changed over the last few months is the potential.
Someone asked some days ago, how to interpret the colours of lava resp. lava fountains etc. on webcam pictures. Best is , IMHO, to compare thermocams with webcams showing the same eruption scene. As this is not possible to do for us re. Holuhraun (only for the scientists, it seems from photos on websites), I’d recomment to do this re. Etna. At the moment, this Scicilian volcano has some small activity, which nevertheless shows how the colours on realtime normal webcams correspond to the colours and the heat interpretation on a heat camera (FLIR, or so): http://www.ct.ingv.it/it/webcam-etna.html
Just return to normal now… maby a trapped flood?
tremor jump again…
Looking to me that it’s more likely to be a small fissure opening up locally in the region of the dyngjujökull station, possibly under the ice. The stop start thing and the wave pattern of the tremor suggests that more than a small jokulhlaup.
tremor picking up at Hamarrin now
A flood from Skafta possible
actually that could be just quakes from BB
Yep, ham is identical to the grims plot. The only one that seems to be picking up the footprints of whoever or whatever it is, is dyngjujokull on both the drumplot and on the tremor graph.
Is anyone thinking it has the signature of a jokulhlaup rather than a fissure? I’m just asking as I can’t see how that could be – why it would look like it is.
Is it spiking again?
http://hraun.vedur.is/ja/vatnajokulsvoktun/djk1_trem.gif
It was. Check the drumplot at http://hraun.vedur.is/ja/drumplot/djk.png which is paralleling the tremor.
Thanks for the info.
Something on the move again?
http://hraun.vedur.is/ja/drumplot/djk.png
Yes, the drum plot’s looking how it did yesterday evening. And the Dyngjujokull tremor guage spiked in the higher frequencies just before these latest “EQs”.
Monday
02.02.2015 08:09:13 64.671 -17.469 9.8 km 4.0 99.0 4.4 km NE of Bárðarbunga
Monday
02.02.2015 08:03:57 64.684 -17.402 8.9 km 3.7 99.0 7.7 km NE of Bárðarbunga
Monday
02.02.2015 08:00:50 64.675 -17.464 9.7 km 4.1 99.0 4.9 km NE of Bárðarbunga
https://www.google.com/maps/place/64%C2%B040%2730.0%22N+17%C2%B027%2750.4%22W/@64.6702267,-17.4518979,14z/data=!4m2!3m1!1s0x0:0x0!5m1!1e4?hl=en
“tremor” signal in the quake plot again…
http://hraun.vedur.is/ja/drumplot/djk.png
http://hraun.vedur.is/ja/vatnajokulsvoktun/djk1_trem.gif
GFUM (=Grímsvötn) GPS station, near GJK (= Grímsfjall) tremor guage, has moved quite a bit in the last three days. Could be icing, but it does fit the emerging picture.
http://www.vedur.is/photos/volcanoes/bbgpseqmap.png
There’s has been, or is an ongoing, swarm in TFZ.
http://en.vedur.is/earthquakes-and-volcanism/earthquakes/tjornes-small/
Something on the move again ?
http://hraun.vedur.is/ja/drumplot/djk.png
Another Spike ?
http://hraun.vedur.is/ja/vatnajokulsvoktun/djk1_trem.gif
There are people on the glacier so that could have been human noise
Thorbjorg Agustsdott @fencingtobba ·
Icelandic scientist are now on #Vatnajokull to install more seismometers due to #Bardarbunga activity. @RUVfrettir
Thanks for that.
According to the RUV report, they’re putting a seismometer at Fjórðungsalda: ie they are monitoring more closely the area north of Tungnafellsjokull where the 2010 fissures appeared and where we’ve seen a good number of earthquakes since August.
Another big one ?
http://hraun.vedur.is/ja/drumplot/djk.png
Magnitude 4.3
Region ICELAND
Date time 2015-02-02 21:34:30.8 UTC
Location 64.62 N ; 17.45 W
Depth 1 km
http://m.emsc.eu/earthquake/earthquake.php?evid=425509
Monday
02.02.2015 21:34:30 64.619 -17.481 5.5 km 4.6 99.0 3.2 km SE of Bárðarbunga
Due to economic reasons I won’t be able to move back to Denmark as things currently are. For that reason I have updated the information on my donation page. It now points towards the Icelandic bank account, not the Danish one.
http://icelandgeology.net/?page_id=212
Two more big ones ?
http://hraun.vedur.is/ja/drumplot/djk.png
A bigger one still at 16:09. One of the biggest for a while now.
von SIL station is back on
“Game of Drones”
ABC – Good morning America from today:
http://abcnews.go.com/GMA/video/gma-flies-drone-erupting-volcano-live-28684474?cid=fb_abcn
A must see. Thanks, Mafl.
Great update of the eruption. It still looks enormous. Crazy to think about the size of eruption a couple of months ago, when the lava fountains spilled over the crater rim…
Why is there an enormous red spike on the drumplot today but no eq above four for it?
New article on Bárðarbunga volcano and the eruption in Holuhraun is up. 🙂