
There has not been any major change in the eruption in Holuhraun. Latest reports are that the lava field is now 74 square kilometres in size. While the eruption is smaller than it was when it started, it is still considered a large eruption based on volume of lava that is now erupting. The crater rim was according to last news around 60 meters high, it might have lowered from last report that I did hear that stated it was around 100 meters high. Since the rim is made out of loose material it is unstable and might suffer from collapses at regular time intervals. SO2 pollution continues to be a big issue in Iceland depending on wind. Once I am back in Iceland I am going to start posting pictures of it for those days it is going to be in the part of Iceland where I am going to be living (north-west Iceland).
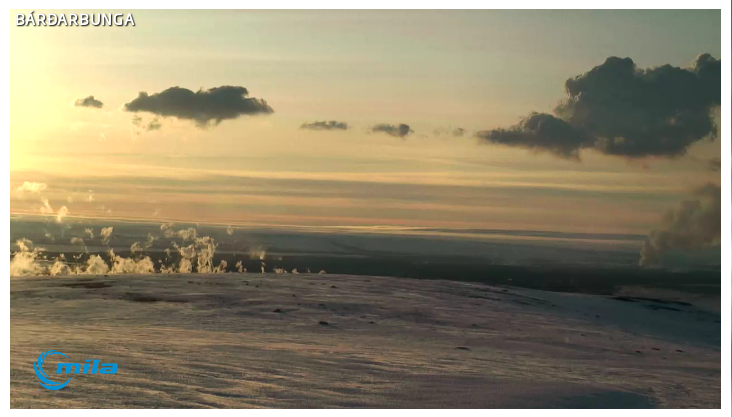
The eruption site today (17-November-2014) as it appeared on Míla web camera at 14:32 UTC. Copyright of this image belongs to Míla.
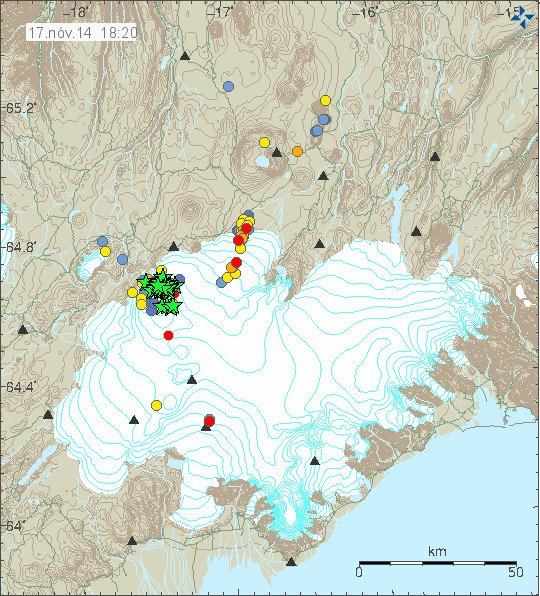
Earthquake activity in Bárðarbunga volcano for the last 48 hours. Copyright of this image belongs to Icelandic Met Office.
Earthquake activity remains the same as before in Bárðarbunga volcano. Largest earthquake on Sunday (16-November-2014) had the magnitude of 5,4. Earthquake activity is heavy at times in Bárðarbunga volcano, after a large earthquake takes place (above magnitude 5,0) earthquake activity drops for few hours in Bárðarbunga volcano, this appears to be normal. The rate of subsidence is about the same, it has slowed down in the centre of the caldera according to the news from today.
Rúv News – New video of the eruption in Holuhraun
Holuhraun eruption – fresh video (Rúv.is, English)
Other: Please note that I have removed mobile device support from this website. The plug-in was old and the newer versions did not work for older mobile devices. Due the old age of this plug-in it was a security risk. So I did remove it for that reason.
Do you have an updated timeline on your move back to Iceland?
Are family and friends stepping up to the plate to fittingly help out?
Do you have a specific town/village, apartment picked out, yet?
What appears to be new is the remarkable string of mag 3+ quakes in the NE, shifting west east and back. This action is like a bread knife slowly sawing through the rock, or perhaps like a large block sinking over the slowly evacuating magma chamber or sill. All the same, by itself, without something else happening, it is still just a huge bag of magma spewing out through the dikes toward Holuhraun.
The build up of energy prior to a mag 5 quake then another build up to another large quake should indicate that these quakes could be caused by the energy of the magmatic system of the caldera,not subsidence of the floor.This process could go on for a long time if the energy being released in the quakes and at Holuhraun equals or exceeds the energy being imputed into the system by the deep source magma.How much more energy is available to the system,if more magma enters at depth then the current stasis could be broken quite suddenly,also if the magma Input subsides then the activity will come to an end also quite quickly?
That sets up an either/or situation. Either the energy is coming from a slow collapse of the caldera or the energy is coming from the influx of new magma into a magma chamber. We think that way, but nature prefers multiple factors scenarios.
Energy might both be entering from below and above. The total amount of magma needed to fill in all the sponge-like rift dikes and to erupt at Holuhraun is at least twice the volume of the sunken caldera. The total needs to be at least 2 x caldera enlargement volume.
This also means that incoming magma alone is not enough. That is the real reason why the caldera is subsiding. It is being sucked down by lessened pressure. As ingoing water into a hydraulic pump.
The energy is coming from the magma ,even the subsidence is due to magma,so the energy is from the movement of magma,no either or situation?
“This also means that incoming magma alone is not enough. That is the real reason why the caldera is subsiding.”
We don’t know that the caldera floor is subsiding, only that the surface of the ice is subsiding. Caldera subsiding is certainly one possible reason, but not the only one. Geothermal heat could be melting that ice from the bottom causing subsidence of the surface and the shape of the caldera prevents any of that water from escaping yet until the level of it rises to a point where it spills through a break in the caldera rim.
Crosspatch,
Yes, they’re only measuring the subsidence on top of the ice field. But the ice is a crystalline solid pretty much throughout. There is definitely some melting on the bottom as small dykes conduct some magma up. But that melting is confined to lakes under the ice which are tiny in comparison to the many kilometers of solid block. The thermal energy required to melt the ice to a substantial difference is huge and would take a year or years.
JB, your use of energy is unclear to me.
Energy is an accounting term used by mathematical physicists, to add up all the possible ‘forms of energy’. The total energy in a ‘system’ is conserved, always remaining some constant.
The greatest contributor in a volcanic system is not gravitational or kinetic, as in magma movement, but in the heat carried by the magma wherever it goes.
https://en.wikipedia.org/wiki/Energy
Every 5 minutes, a drop of 10 cm.
1878.1m
Isn’t a drop of 10 cm every 5 min a bit of an increase in such descents?
Hmmmmm
It’s correcting now, but still impressive to see because it was a slow moving straight down…
Monday
17.11.2014 20:07:30 64.670 -17.414 8.9 km 3.5 99.0 6.3 km ENE of Bárðarbunga
Monday
17.11.2014 20:04:03 64.671 -17.459 7.9 km 4.3 99.0 4.8 km NE of Bárðarbunga
Monday
17.11.2014 21:30:01 64.608 -17.457 0.1 km 4.1 99.0 4.9 km SE of Bárðarbunga
I have been watching this event since early September when I made a trip to Europe and was concerned an eruption could disrupt my travel plans.
Unlike Mt. St. Helens where there was a huge bulge in the side of the mountain indicating a huge pressure build up, I’m not seeing that kind of pressure build up here since the rift is acting like a relief valve allowing lava to flow out.
The near constant rate of drop of the subsisdence in my mind probably reflects the rate of the subsidence conversion to molten lava which then flows out to the rift. My guess, this will continue for a long period of time. The game changer could be when the glacier above the subsidence meets the magma which could result in a pressure build up faster than what the rift can relieve.
What am I missing?
Maybe the glacier gives the impression of constant subsidence,by acting as a buffer?The ice is subsiding (or a better term would be deforming) ,in a consistent way ,like the suspension on your car takes an abrupt bump and smooths it out.The floor is subsiding due to the convection of magma under it causing progressive weakening and slumping?
The change in glaciers in Iceland as it appears in Mýrdalsjökull glacier.
http://earthobservatory.nasa.gov/IOTD/view.php?id=84707&src=fb
I see the flaring we were speculating about last night is now clearly visible and is definitely not refracted light. Centre foreground about a third of the way to the main lava stream.
You mean this in the red circle?:
http://abload.de/img/14-11-18-003a-bardam7ufg.jpg
I think it is a cooler lavaflow…a’a-like…
Note: As I live in germany, at the other side of the earth, question and answer will last longer 🙂
In a few hours I go to bed…
And another picture with a little outbreak of lava at the right:
http://abload.de/img/14-11-18-004-bardawjpsb.jpg
You mean this in the red circle?:
http://abload.de/img/14-11-18-003a-bardam7ufg.jpg
I think it is a cooler lavaflow…a’a-like…
Note: As I live in germany, at the other side of the earth, question and answer will last longer 🙂
In a few hours I go to bed…
There is another flare at the right only for a short time.
So the lava has perhaps changed a little bit her route:
http://abload.de/img/14-11-18-004-bardawjpsb.jpg
Hey Mafl
Yes that is the one. Living in Oz, I am probably the only one to see a lot of the things that occur and I occasionally see things which are not run of the mill. What an extraordinary event this is. I feel very priveledged to be able to witness it all the way over here.
You are up early! 🙂
Perhaps you can take screenshots?
Yep- I live on a 3500 acre property. Always up at 4.00 am. Dogs barking, Roosters get going about then. It is a great time of day. I will have a go at taking screen shots next time something happens.
What time is dawn in Iceland?
At the moment it is getting light around 9:30 here in the South, probably closer to 10:00 in the north of Iceland. (Iceland is on GMT so relate this to the time zone you are in). By the winter solstice it will get light around 11:30 but again a little later in the North. So not too many hours of daylight to get a clear view of BB I am afraid.
I am wondering when some people here will realize that the real-time data (in 5 min steps) from the gps do not mean anything at all. I am also wondering where the water should go after melting. If it stays in the caldera bowl one should keep in mind the density difference between ice and water and what it would mean in regard of the 40-50 m drop. Likewise, why should we see additional cauldrons if the overall drop itself is caused by melted ice? I would also like to mention – most of the people here know that – that it needs 4000 M3 earthquakes and more than 100 M4 to release the energy of a M5.4.
The IMO have answered that one, I posted it here several times from the email they sent me on 31st Oct –
“A:
The gray fluctuating data in the background is the processed real time 1Hz
data which is subject to number of uncertainties.
The answer is probably both. Part of the fluctuations are noise part of them
are real. I have not analyzed the data in way that enables me to distinguish
this though.
There are probably some fluctuations on the surface of the glacier associated
with earthquakes, the fact that the Ice is flowing towards the center, waves
propagating through the glacier and etc. These signals can have pretty wide
frequency spectrum depending on the source of the waves and it’s path.
However only part of the fluctuations you see on the graph are real movements.
There can be orbital errors, multipath effects, satellite geometry and possibly
some atmospheric variations and more.
The blue line is a 180 min median, and for all practical purposes this gives
the steady state movements and the offsets that we want to follow.
The red line is a 30 min median and might hint on real variations on the ice
surface, although they would need proper analyses for a meaningful
interpretation.
The grey line in the background is, as you say more or less noise, at least
until the data is properly analyzed, although I suspect that within it lie
interesting signals.”
Regards water in the caldera, this is strewn with fractures and is not watertight, increased flow has been observed in the river but is not a substantial increase.
You will find info of conductivity in the rivers here –
http://vmkerfi.vedur.is/vatn/vdv_gmap.php
I have just realised I was overly optimistic when I mentioned 9:30. It is starting to get lighter but daylight will not properly dawn until closer to 10:00 here in South Iceland, a little later in the north.
Thanks. I kept waiting to go to bed until I saw some bit of dawn . . . then I realized how far North Iceland was and went to bed. LOL.
Interesting video clip from the BBC
http://www.bbc.co.uk/news/world-europe-30092530
Jon, this morning we felt an earthquake in Grimsnes at 1o:31, south Iceland, we live just by Hestfjall, the fracture zone of SISZ.
But it doesn’t show in the IMO list. It shows at 10:31 UTC in your webicorder, at Hekla. http://www.jonfr.com/webicorders/tremoren.htm
And it shows at Hekla strain counts, as the next and only significant event until now, since the earthquake at Bardarbunga around 9:35.
http://hraun.vedur.is/ja/hekla/thensla_hekla.html
All other quakes recorded on both instruments are Bardarbunga quakes.
I am surprised it doesn’t show in IMO map, it was surely a M2 if it was local. Or even a M3 if further near Hekla. We know how badly quakes at Hekla are sometimes detected.
Where was this quake located?
We felt it clearly. In 4 years, this was the second strongest I ave felt at the SISZ.
Jon, do you have more data to confirm the exact location of this quake?
I did talk to Icelandic Met Office. There is no earthquake registered at this time and what you see on my geophone is noise. This mean you felt something else. I don’t know what.
Thanks Jon. It’s great to know you have done that.
Now I am baffled to know what that event might have been.
I was certain we felt it like a small quake (like a minor version of the M4 April’s quake in the SISZ, epicenter very close to me, that night)
And I was curious because of the spike recorded both in Hekla strain meter and your Hekla webicorder at around 10:31. What confuses me is that I am at a rather significant distance from Hekla, 40km.
I don’t know what must have occurred. But all IMO drumplots show nothing at that time. It felt just for 2 seconds, both sound and ground vibration felt.
Just as a sidenote, once I felt a M1.5 recorded right at Hestfjall, some 5km south of where I live. It was barely perceptible that one, even less that the event of this morning.
Curious, with your personal knowledge and location I am inclined to believe something happened Irpsit. Maybe it will come to light later?
Irpsit, I have an app on my phone that monitors europe for earthquakes. Yesterday it registered a 3.6 at Hekla, depth 5 km location 6399,-1966 but the time is way out 17 nob 1752 UK time. I haven’t found this one on any of the other sites I use.
That’s 17 Nov 17.52 UK time
Test
I have removed the reCAPTCHA plug-in. It was creating world of problems for me when I tested it and it did not work properly. So if you see any spam that slips trough please let me know so that I can remove it. Just email me the link to any spam that is spotted.
Comment updated.
test 2
If you see this comment, all worked fine with commenting – logged in or not 🙂
Thanks Jon!
I removed the failed plug-in so now there is just math test between the comments and the spam bots. So if you see any spam, please report it to me with an email with link so I can remove it.
It’s so easy, as we say a child can do the laundry.
Comments works. I have fixed earlier problems. 🙂
Iceland Eruptions @wslangerak · 6 min Há 6 minutos
EMSC: Magnitude M4.6 | Date time 2014-11-18 18:26:28.0 UTC | Location 64.68 N ; 17.05 W | Depth 10 km #Bardarbunga
There appears to be some type of data failure at Icelandic Met Office. Earthquake lists are not updating correctly.
Luisport…is this your website ? weerstationlangerak.nl/bardarbunga/
Ney, Luis is from Port.
No it’s from a friend of Holland…
Cool website…I have been following it for weeks.
And I like you posting the quakes…
18.11.2014 21:40:36 64.834 -16.871 7.2 km 0.7 99.0 17.0 km ENE of Kistufell
:/
Green star near Tugna… Tuesday
18.11.2014 18:56:14 64.735 -17.920 2.7 km 3.1 99.0 7.2 km E of Nýidalur
Looking at the percentage of earthquakes >= 5.0 out of the total earthquakes >= 3.0:
For the first table provided, for 16Aug2014 to 07Oct2014, we had 45 / 469 or 9.595%
Deducing by subtraction using the 11 week earthquake table provided for 16Aug2014 to 31Oct2014 (the one with 434 earthquakes 3.0 to 3.9), we had for 08Oct2014 to 31Oct2014, 16 (>=5.0) / 254 (>=3.0) or 6.3%
But is this statistically significantly lower? Using a 9.595% baseline from the initial table, and using a 95% confidence limit (or 2 sigma control limits), a significant shift
in this percentage would be outside (5.894% and 13.29%). So we have 6.3% is within the 95% expected range of a 9.595% baseline with binomial distribution. When will this earthquake table be updated again? or can someone provide similar summary data, say on a weekly basis?
Is this you are looking for? http://hraun.vedur.is/ja/viku/2014/
… click on one week and then on [Skjálftalisti]
thanks, but I can not copy the data into a spreadsheet. Not sure
why.
I could have sworn this was a new vent, so I grabbed this screen shot. Then only a moment later, it was gone. Must have been water vapor or a gas release or something.
http://tinypic.com/view.php?pic=11to2uw&s=8#.VGvF3clqzGE
I think it was a mini-tornado over lava…
You are probably right.
the eruption is very strong now…
Does anyone know how the Board makes a determination that M5.0’s are decreasing?
14 November 2014 12:00 – from the Scientific Advisory Board
The volcanic eruption in Holuhraun continues with similar intensity as it has for the last two weeks. Lava continues to flow out of the lava lake in the crater to east southeast. Emission of sulphur dioxide from the crater appears to be constant. Seismic activity in Bárðarbunga continues to be strong but the number of earthquakes stronger then M5.0 seems to be decreasing.
http://www.vedur.is/photos/volcanoes/barc_gps_all_is.png
Big quake appearing on the plots now. Nothing yet on emsc… Looks like a pretty strong and long one
It looks big because of the midnight rescaling of the drumplots.
But looking at the percentage of earthquakes 4.0 to 4.9 out of the total earthquakes >= 3.0:
For the first table provided, for 16Aug2014 to 07Oct2014, we had 117 / 469 or 24.95%
Deducing by subtraction using the 11 week earthquake table provided for 16Aug2014 to 31Oct2014 (the one with 434 earthquakes 3.0 to 3.9), we had for 08Oct2014 to 31Oct2014, 111 / 254 or 43.7%
But is this statistically significantly higher? YES Using a 24.95% baseline from the initial table, and using a 99%+ confidence limit (or 3 sigma control limits), a significant shift in this percentage would be outside (16.8% and 33.09%). So we have 43.7% outside the 99%+ expected range of a 24.95% baseline with binomial distribution (N=254).
[and correspondingly, the percentage of 3.0 to 3.9 out of total >=3.0’s is significantly lower for the 08Oct to 31Oct2014 time period. 50% vs. 65.49%]
Love to see your thinking and calculations . . . though I’m somewhat math challenged–particularly without a stat program and computer. LOL.
They’re just eyeballing the charts. How about 10% level? That would not be statistically strong, but it loosely makes the point anyway.
SteveG For the 6.3% of M5.0+ earthquakes out of M3.0+ using 90% confidence (alpha = 10% vs. 5%), although technically we should select alpha beforehand (a priori), we would look at 9.595% +- 1.645*sigma (using normal approx. to binomial distn), which gives 6.55% to 12.64% so the 6.3% over the 2nd summary period is out of the 90% expected range. Roughly speaking the eyeball method seems to be on the order of 90% confidence as you suggest.
Just out of interest – I have been watching the data on conductivity, in particular the Jökulsá á Fjöllum, but then I noticed the data for Kreppa V233 showing a climb in water temperature and conductivity –
http://snag.gy/zW2Ec.jpg
I’m just curious if it has any bearing given its proximity to Jökulsá á Fjöllum
Conductivity varied between 40 and 70 in the last 7 days and there is a continuous increase in temperature from 3.7 to 4.3 in the last 7 days.
Location of Kreppa for anyone interested –
http://snag.gy/CzbFG.jpg
What I wanted to say is that these changes (e.g 1.3% change in temperature) are IMHO not significant.
Scots John, the changes in the chart are consistent and real.
Note that the height and volume have peaked and are now lower, meaning that whatever event caused the rise has peaked for the moment. You’d need to look at historical data to say more.
The temperature and acidity are rise preceded the rise in volume by up to 12 hours. Again, without historical data not much else can be said.
Minor eruption under the icecap?
That’s what I was wondering, the problem is where?
I updated the conductivity and took it back two months –
http://snag.gy/3Tx4d.jpg
What caught my attention was the Jökulsá á Fjöllum conductivity falling when I would have expected it to be the other way round.
http://snag.gy/UW0Lo.jpg
The two rivers are unrelated for this purpose. This variation in Kreppa is local.
A leak from a sub-glacial lake?
http://avd.is/en/?page_id=352
New hires pics from yesterday: lavafield, eruption, landscape
https://www.flickr.com/photos/82763166@N00/sets/72157648949729898/
Just found: Timelapse video 14./15. Oct:
https://www.youtube.com/watch?v=y3RCo1xm368
It’s from November. 🙂
Yes, sorry…I’m sometimes sloppy…
But it was for you, because of the daytime-views… 😉
Scots John et al. I agree with JR. These look like natural weather-related variations in temperature and stream discharge at Hreppa over the last couple of days. The recorded temperature range (4.25 – 4.31oC) is very small and above freezing, and the variation in water depth is only just over 5cm. The electrical conductance (roughly 44 to 52 microSiemens/cm) is fairly low, indicating dilute freshwater. I would guess that some weather-related variations in snow and ice-melt have been going on. Plus, of course, the plume of acid gases from Holuhraun will affect the pH and EC of surface waters.
There is something wrong with the longer record, probably a problem with the submersion or calibration of the probe. Electrical conductivity cannot be negative, let alone give large negative numbers. Only the positive values look realistic, as also suggested by the fact that the average is given as ~57 microSiemens/cm.
Could be. The changes are small, but steady and consistent with each other. If weather or pollution related then why shouldn’t Jökulsá á Fjöllum reflect the same variation?
New article is up on the eruption in Holuhraun and the activity in Bárðarbunga volcano.