
No major change took place in the eruption in Holuhraun during the weekend. The lava field is now around 70 square kilometres wide and it keeps growing each day. I don’t know the total volume so far, since that depends on the thickness of the lava. Last calculations that I know of estimated it to be around 1,0 km³, it is save to assume that volume is now greater since the last estimate that I know of is at least one month old by now.
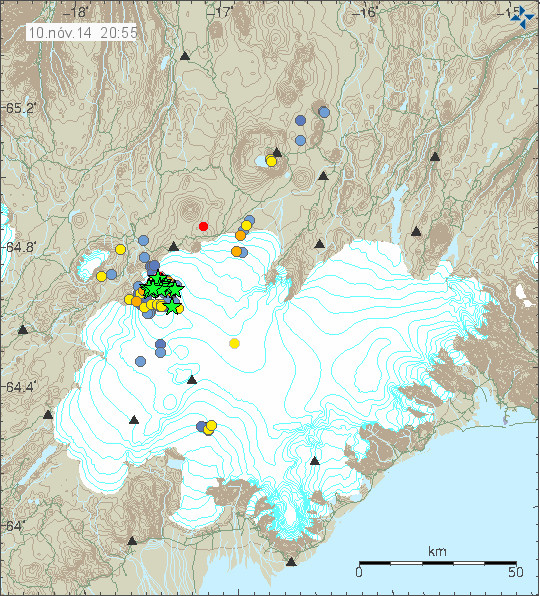
The earthquake activity in Bárðarbunga volcano. Copyright of this image belongs to Icelandic Met Office.
Largest earthquake this weekend had the magnitude of 5,2. Other earthquakes where smaller, but many magnitude 3,0 and larger earthquakes did happen as usual in Bárðarbunga volcano. The crust in Bárðarbunga volcano is now heavily fractured, this allows heat from the volcano easier way to the surface. This also means new hot springs are going to open up and older ones are going get more active. There is no major change in Bárðarbunga volcano eruption at the moment, as has been the case for most part of past two months.
Article on what is happening in Bárðarbunga volcano
I am working on a article (in my head at the moment) on what is happening inside Bárðarbunga volcano. It is not ready yet, I do hope to have it ready tomorrow if I can process all the data for the article, in order to properly figure out my self what is going on in Bárðarbunga volcano.
My geophone network
I run a geophone network of just two geophones in Iceland at the moment. Once I get an apartment the total number of working geophones is going to be three. I have decided that once I move from Iceland to Azores Islands[1] it is not going to be workable to keep the network running due the technical problems doing so. I am not going to stop recording earthquakes, I am just going to do so in Azores Islands. At the moment I also have four year backlog of earthquakes that I have to properly add time and location data to. That is a lot of earthquakes over this period, since large events have happened and Bárðarbunga alone added up to 2000 earthquakes to my earthquake database in August and now I add around 10 – 20 earthquakes from Bárðarbunga volcano each day (this is just average). The geophone network as it now stands is going to be running for the next 5 – 10 years while I live in Iceland, after that I am going to relocate it to Flores Island when I move there[2]. At the moment I don’t know for sure when that is going to happen, all I know now is that it is going to happen.
1: I am currently living in Denmark. I move next month to Iceland.
2: I plan up to ten years ahead so that I know what I need to do and know before I do it.
Hi Jon,
I have been following your blog daily since Eyjafjallajökull. Mostly lurking occasionally commenting. The site is always interesting and is not only a good chronicle of scientific thought and specualtion but also of human nature for good and bad. Just really wanted to say good luck with your plans and keep up the good work!
Cheers
Craig P
Jón, I admire your tenacity and vision tremendously. I hope you find a nice apartment which suits your needs, whether you wish to be in the capital or somewhere more remote. Many thanks for the huge volume of work you are doing and sharing with us, I really look forward to reading the article you are working on, whether that is tomorrow or sometime later.
I want to ditto Kay Tina Cook! Jon, thank you for this wonderful site, and I am looking forward to your update on the inner workings of Big B. I think your plans for the future sound very exciting, and I admire your organization.
Monday 10.11.2014 22:40:03 64.970-17.450 7.4 km 4.7 50.5 12.5 km NW of Trölladyngja
Does anyone have one of the later links to the lava flow dimensions pics . . . orange in color, IIRC . . . where the river streams were fairly clear . . . would like to compare with this last one.
Here is the map with latest information. Text is in Icelandic.
http://jardvis.hi.is/kort_af_utbreidslu_holuhrauns
THANKS for your effort, Jon,
However, I have that link from just above–that link is not that far back.
I’m looking for one of the recent but not latest map with the orange coloring for the lava flow so I can compare it with that latest one at the link you shared.
Hello Da Xin,
have a look at: http://www.vulkane-islands.de
I’m sure you will find the one you are searching for here, even though if you might cant speak german.
THANKS TONS. YES, on page 2 . . . was found this one:
http://www.vulkane-islands.de/wp-content/uploads/2014/10/lavafeld25-2C10.png
Which should be interesting to compare with this one
http://jardvis.hi.is/kort_af_utbreidslu_holuhrauns
Hope I can print them both off for pondering.
My looking at the two pics . . . it appears to me that the river has been MUCH more pressed against the Southern . . . South-Eastern bank???
Am I seeing things accurately?
Does this river freeze solid in winter?
I tried to find a good topographic map of that area and have failed so far.
I should try again.
If anyone has a link for one, please share it.
Maybe i can help you again with this link here: http://en.ja.is/kort/?type=aerial&x=548212&y=432605&z=2
This is one of the better maps I’ve found but still not very good topographic detail of that area.
http://mapsof.net/iceland
This is my favourite map Da Xin
http://vedur.maps.arcgis.com/home/webmap/viewer.html?webmap=5a39c14526f44ea1a43a36bb89960c41
Great map.
Thanks. That’s about the level of detail I was looking for.
The USGS has a bunch of topo maps that backpackers use with all the terrain lines very well done. I can’t seem to find such a thing for Europe.
I use this for detailed analysis
http://gismo.vedur.is/ofanflodakortasja/almennt.htm
Da Xin,
Europe is not a country, it is a group of individual countries (compare it with the UN) that aggreed to shift some responsibilities to a higher level.
This is a very fragmented picture where a lot is happening twice or three times.
Geology is not one of them: each country is dealing with the subject on it’s own. For sure topography is a national item.
But we can buy high detail topographic maps, some regions even at a scale of 1:15000. Military installations are not detailed.
Only limited is available online for free, it is seen as a pay for the service from the government. You will be able to get digital versions but you will have to pay for. And sometimes it is very cumbersome to reach the right website as you will have to deal with the local languages.
My tactic is to buy the maps of a region the day I arrive, in a local bookstore.
I can imagine Iceland does not have the full country mapped out in high detail due to limited resources and often changing. Althow the continuous monitoring of the shape is at very high scientific level.
Of course we have detailed maps. Here is the primary resource.
http://www.lmi.is/
There are reasonably good, and reasonably recently surveyed 1:50k maps of Iceland that can be found by digging around on the LMI site (see below). They are adequate for getting a sense of what’s where, but they aren’t 100% reliable for navigation in the field because the terrain can be extremely complex, and rivers change course (dramatically!), lakes appear and disappear, and glaciers recede.
This page gives access to much older and not very reliable surveys: http://atlas.lmi.is/kortasja_en/ Click on “Atlas Maps”.
Nice one. I can now take a virtual hike throughout the land, sleep in my own bed, then continue the next day. 🙂
Great blog, have been reading it for a month or so, just found the comments. I did contribute to this worthy cause. Keep up the good work!
I am not a geologist, but I have two questions. First, the image from the Bardarbunga-2 webcam from Mila sometimes shakes. Somehow it doesn’t look like wind shake. Is this perhaps a free seismometer?
Second, if I understand correctly, a relatively constant amount of unmodified deep magma (ultramafic) is pouring out of a rift of relatively constant dimensions. This would imply that the pressure at the rift is approximately constant, even though the floor of the caldera is dropping. One obvious model then is that there is an isolated magma chamber higher in the mountain and the difference in height between it and the rift is creating the pressure. The opposite extreme would be that the magma chamber is deeper underground than the rift and the pressure in it is even higher than it is at the rift. Do geologists know which of these models is most likely? Is there some other model I haven’t thought of?
@Chris,
Perhaps you &/or others can check my perceptions for me . . . I have your map enlarged so that the multiple streams portion of the river takes up about the left 1/3 of the image.
There’s the raised feature “Langanhlio? ” sticking up North just to the right of center like an index finger pointing at a little bump of a hill.
Just to the north of that bump of a hill is another major stream of the river with a wide space between it and the bulk of the river with multiple streams North and West of there.
Now, IT APPEARS TO ME from the latest radar image . . . that the lava flow has pushed totally across all that multiple streams section and pushed up right against or almost right against the bank just to the South of that Southern set of streams of the river.
Am I seeing it correctly?
And, it appears to me that IF–perhaps a big IF and perhaps not–IF the lava flow continues to push across what is mostly a fairly level plain between where it is now and the ‘finger’ ridge sticking up–that a fair amount of water could be dammed up???
Depending on how high the lava dam got . . . the water could be forced out between the lower terrain South of that finger ridge and between that finger ridge and the bunch of hills South and East of there–which seems to have a road going along the Western side of it.
Is that plausible?
I was a bit surprised to see how much of an expansion had occurred since the last such pic. The lava field is clearly not cooling off much at all under the thin black surface.
It seems plausible to me that the lava flow COULD close the gap up against those higher terrain features to the mostly East of and including that finger ridge.
It might be that there’s enough of a downard slope generally toward the NE that it may not do that–or it may not do that first but do it 2nd or 3rd in sequence to thickening in that broad plain to the NE between the finger ridge and Svarta???
Just trying to guess and imagine what could happen and what the implications would be for the water flow.
Was looking, just now, at the SW end of the lava flow. That terrain seems flat ENOUGH that IF the lava dam became high enough to the NE of there, the water might flow around the SW end of the lava flow. Is there anything to prevent that???
Yet, it appears that there’s another watershed to the West of Trolladyrngja. So there seems to be a bit of a watershed divide between that watershed and the on that flows by the lava flow. How high that subtle ridge/divide is, is hard for me to tell from the map.
Flowing water has always been a fascination to me. I grew up on this farm I’m on the last acre of . . . from 1952 on . . . and I was forever doing landscaping projects with the irrigation ditches etc. LOL.
Then there’s the whole other issue of an eruption at Bard dumping incredible amounts of water North, NE and SW of the glacier. That could alter a LOT of terrain in a big way in a big hurry, it seems to me. Thankfully there are no houses in that area and the nearest houses could at least have some meaningful warning–unless it came early in their nightly sleep cycle. I hope they have provision for that.
Thanks for the help with the maps.
.
It looks like the flow on the east side is starting to approach higher ground, but the lava field growth does shift direction occasionally, the long run to the north stopped short of cutting off the the river. I am not sure how soft the ground is to the east it may be the river can continue to cut a channel for a while yet around the east side.
Good points.
Have also wondered if the soil was soft and sandy enough for the water to cut a path under the lava flow.
Thanks for your kind reply.
StuSchaffner….reference your comment on the mila cam shaking. I witnessed the cam2 shaking for about a minute a couple of weeks ago and was told it was wind. I am not so sure as the weather at the time was not that windy and there was a clear view of the eruption at the time. I am thinking that I did witness an EQ!
I did ask a question a few weeks ago, that during an EQ, does the ground just shake, does the ground “bounce”, or sway from side to side?
The B2 cam shake from winds is very noticeable as it is operating at a high zoom. I digitally zoom that further and observe shake even in lighter winds.
Wind/Zoom and/or EQs?
Have a look to a 6.8 Magnitude Earthquake in 1790 m
https://www.youtube.com/watch?feature=player_embedded&v=UPwSN9gUG5c
(Source: http://de.wikipedia.org/wiki/Amchitka#Atomwaffentests_auf_Amchitka)
An article about the gas pollution in the south east
http://grapevine.is/news/2014/11/11/mass-death-of-mice-on-south-east-coast/
What aboutthe verical GPS now?
Strong shift or just a technical dault?
fault?
This happens sometimes. It´s either problem in the signal or ice on the antenna. Or both.
This time, it looks more real than usual… pretty persistent…
The pale blue lines indicate there is a large inconsistency in the signal. It´s not real.
Personally, I’d rather be trekking through that landscape, guesstimating navigation across pathless, seemingly endless grey wastelands of gravel and sky, being pelted with snow (even in August), wading thigh deep, fast-flowing rivers, and then be lying in my tent not having seen another person for 6 days and wondering whether the tent is strong enough to survive another night of gale force winds. 😉
Oh, and I nearly forgot: add to that list the pleasure of pulling on cold, wet clothes and boots the following morning!
Don’t know what happened there: my previous post was meant to be a reply to SteveG at 14.54.
A good 4×4 is always handy, though it’s not always easy going even for the most robust…
http://sphotos-h.ak.fbcdn.net/hphotos-ak-ash3/531781_442051925889886_93086970_n.jpg
Andrew, I envy you. For me it is nearly impossible to avoid crowds, except perhaps watching stars after midnight on a moonless mid-winter night on top of a small peak in a well-groomed state park.
In Iceland, I prefer walking. Australia… a 4×4 with AC…? Most certainly!
@Porsche928
That’s quite a picture! Wow! But surely not taken Iceland (trees + a tiled roof)?
@SteveG
That’s a pity. I’m sorry to hear that.
@Andrew
Picture is from NL. Where the ecosystem is (much) less vulnerable compared to Iceland.
You have seen the 3.9 EQ near Tungnaafell?
Is this stressrelated tectonic or is it the volcano?
Interesting development. A renewed dyke?
Bardarbunga caldera up +1,5m in a couple of hours? What is happening?
http://hraun.vedur.is/ja/Bardarb/BARC/
Again, noise in the signal.
Probably right Kolla, but this is an unusually big disturbance…
Kolla, normaly I agree with you, but it looks like something has changed. There’s a data leak around 13:00, then the value has risen and has stabilized. Let’s see …
You are right. It looks like it´s stabilizing now. Guess we´ll have to wait a while longer to see if it´s legit.
Staff from Iceland Met Office was moving the antenna upwards since it was snowing down. It is easier to do that than to dig the GPS antenna from the snow.
Let us guess, they did forget to take some cameras with them to make some pictures?!? Didn’t they? 🙂
Maybe… inflation ?
The pressure up might be stronger than the proccess of subsidence.
Or maybe the GPS is crazy . hehe
GPS Signal looks settled again. Next few hours will be interesting
Very strange if it is real: 1,5 m “jump” without a big quake?
Starting to drop a little now.
Well, if this is a bump, it´s a real big bump. And because we never really figured out what was causing those bumps, we don´t know what this means.
When i sai it was a jump in vertical GPS some hours ago someone said it was ice etc. and i said OK. But now it seems to be persistent.
Anyone have some idea?
The university just tweeted they moved the gps and subsidence continues at previous rate
Univ. of Iceland @uni_iceland · 9 min Há 9 minutos
Some people have also been wondering about the amount of SO2 released from #Holuhraun eruption. Answer: ~40-60 thousand tonnes/day
Univ. of Iceland @uni_iceland · 15 min Há 15 minutos
… [2] was being lifted by scientists because of heavy snow. #Bardarbunga is still subsiding at a similar rate as before.
Univ. of Iceland @uni_iceland · 16 min Há 16 minutos
[1] For those following the subsidence of #Bardarbunga may have seen the uplift of 1.5m today. The GPS monitor…
So they dug it out. Makes sense.
… and obviously they weren’t afraid that Bardar might erupt just under their feet…
Hi from USA I been reading your blogs since August as one source to keep up on Iceland volcanoes I like ur blog and find it informative
Tuesday
11.11.2014 19:39:47 64.680 -17.490 1.1 km 3.9 50.5 4.8 km NNE of Bárðarbunga
Acid snow due to toxic gases including SO2 emitted from the eruption in Holuhraun in the northeastern highlands has fallen near the eruption site.
…
Meanwhile, farmers in the Höfn area, Southeast Iceland, have found a large number of dead mice which appear to have died suddenly, ruv.is reports. It is assumed that they died due to high levels of pollution from the eruption. SO2 in the area measured 21,000 mµ/m3 in late October, a record in inhabited areas since the eruption began two months ago.
http://icelandreview.com/news/2014/11/11/acid-snow-and-dead-mice-eruption-pollution
Not good.
Tuesday
11.11.2014 19:39:47 64.679 -17.516 3.2 km 4.4 99.0 4.4 km N of Bárðarbunga
So… does someone really believe that’s possible to move dozens and dozens cubik km of rock and solid ice for more or less 1.5 meters without any massive quake or noise?!?! Believe me… I’ve experienced a 6.0M earthquake 20 km from my house, at night. Ok, it was tectonic but just 1 meter in height per 300 meters in width, 1.5 km deep. Believe me… it’s terribly scaring and huge. 1.5 meters jump for the whole Barda rock plug it possible in few seconds just for a main eruption and it should be announced by a big quake.
The uplift of 1.5m does not look like an abnormal graph, in fact it looks like a real measurement. Then the several quakes in the 3 to 4 range near the surface also of interest. Hope Jon has an update and comments soon on this; no comments means hes reviewing and researching.
please read a few lines above. It did not need a few weak quakes – just one strong scientists arm
No. It was not a real reading. It was just a scientist digging the GPS out of the snow.
i agree with that, something has changed in the chart this is not normal.
It is normal. That reading was not real.
I take little notice of the gps , just an occasional glance,it really is just one indicator among many and perhaps not a particularly meaningful one,as it measures only one point on a 80 km2 glacier covered caldera.
I think one gps device also completely pointless. says even from nothing. except the whole caldera is high. then we see but even so and do not need a gps unit.
I don’t really dare to comment any of you guys since many of the comments does show dedication and knowledge. Latest update from vedur.is is: “Not much has been seen on webcams due to poor visibility, but a steam plume could be seen on a webcam on Vaðalda.” My question is: ” What does this men to you guys?”
@Eric: Here you can view some screenshots from today. The steam is because cold snow on hot lava.
http://www.brisske.de/Fotos/Public/index.php?AlbumDir=/Fotos/Public/2014-11-11_Bardarbunga
It looks, like they lifted the GPS-unit by another 6 m actually (in the middle of the night?) … Seriously spoken, the GPS measurement seems to be rather worthless at the moment.
Scale has also been changed (why?).
and its coming down again, scale switched back; what was like 6 m before is only 2 m now … really confusing. Let’s sit and wait.
Here is an GPS-example with translation into english … hope this helps.
http://baering.github.io/img/bb-caldera-explanation.png
Once the instrument is moved then the previous chart should be scrapped and a new chart plotted from the new starting height?
The GPS is not meant to be an exact measurement. It´s only an indicator so they can see if the caldera is still dropping.
Article that explains what is going on in Bárðarbunga volcano is up.
I think the up-lift on the GPS chart could have been caused by general ice heave, it could have sunk in another place and caused it to rise where the GPS is located ,more like a seesaw I would say . We just don’t know how much movement is going on.
New article is up on activity in Bárðarbunga volcano. Its for 12-November-2014.