
This is the update for Bárðarbunga volcano on Friday 31-October-2014.
Not much has changed since Wednesday (29-October-2014) update in Bárðarbunga volcano. Earthquake activity continues as it has been doing for the past two months. No major change has been taking place in according to GPS data. No major change has happened in eruption vents in Holuhraun, the lava field is now around 65 square kilometres in size.
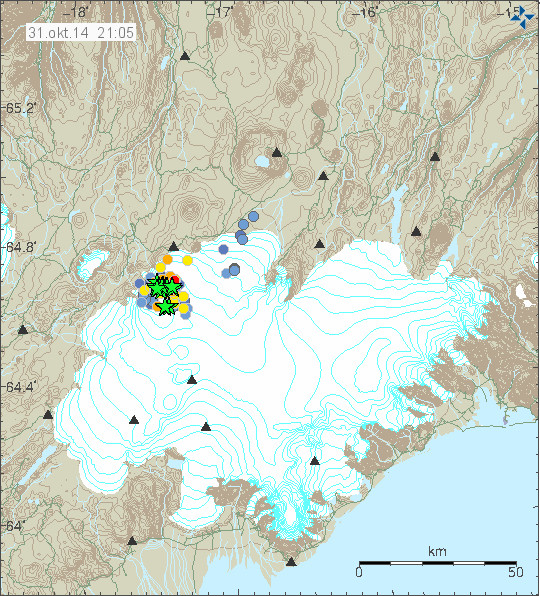
Earthquake activity in Bárðarbunga volcano for the past 48 hours. Copyright of this image belongs to Icelandic Met Office.
Strongest earthquakes for the past 24 hours have the magnitude of 5,3 and 5,2. Other earthquakes have been smaller. There is no change in earthquake activity in Bárðarbunga volcano and the caldera continues to drop around 40cm/day at the moment. Current SO2 output levels are around 20,000 to 40,000 tons/daily of SO2 from the eruption in Holuhraun. Bad weather has blocked proper earthquake detection and monitoring of the eruption in Holuhraun and of Bárðarbunga volcano. The weather is going to be extremely bad in Iceland for the next 6 – 10 hours. Other than this I don’t have any more news of Bárðarbunga volcano eruption.
Article updated 01-November-2014 at 00:30 UTC.
So is the general agreement that the dropping of the caldera is infact just the gradual melt of the glaciar from below??
Just an idea…
If the above is true, could the caldera actually be inflating slowly? The sudden influx of magma just below is actually warming the ground below the glacier causing the glacier to melt. However the rate of melt is greater then the rate of inflation and this give the impression of subsidence.
I don’t think there is general agreement; but there are certainly some very strongly held views!
I have two problems with the subsidence is due to melting view: Where has all the water gone, and the amount of heat needed to melt all that ice.
The volume of the depression is of the order of 1 cubic km. If the melt water has drained away, why has it not been detected? I think I read somewhere that under optimum conditions, basalt lava can melt about 14 times its own volume of ice, so we would need at least 0.07 km3 of lava to have erupted in the caldera, or some incredibly strong hydrothermal activity.
If the meltwater stayed in the caldera, then to get the 1 km3 depression, about 10 km3 of ice has to have melted, which needs all the heat from 0.7 km3 of lava to achieve.
Somehow, if my rough math is anywhwere near correct, I just can’t believe that it can have happened that way.
Perhaps a large volume of magma is close enough to the surface to warm the surface to maybe a few degrees above freezing. The melt would be slow & gradual and I guess this could disperse down the glaciar fairly inconspicuously.
@Ian. Your slow and gradual melt amounts to about 87 m3 of water per second, at the present rate of subsidence. That’s about 45% of the average flow rate of jökulsá á fjöllum at Dettifoss. That is hardly inconspicuous! Why hasn’t anyone noticed it, wherever it’s supposedly going?
The problem is we are unable to say how big an area has sunk,we only have readings from one GPS station, some other areas may have not sunk at all, or far less than under the GPS, We know that there areas around the rim have shown signs of slow melt.
I think it is very hard to try and estimate how mush melt has/or is going on from one area of GPS data. I think it is going to be a waiting game at the end of the day.
Maybe it could be draining through multiple sources??
Ian, how could be just melting. Do you think ice melting could cause all these M5 quakes? These are earthquakes, not icequakes. And most M5 quakes result in GPS sinking suddently. How could that be?
Why are you asking me this?
As you will read, if you go back and read it again, i was merely speculating on a ‘what if’ basis, with regards to the growing idea I’ve noticed is starting to frequent posts on here.
However sticking to the original tone of speculation..
the earthquakes are not happening in the ice, they are happening within the volcano itself, oh and there was absolutely no mention of the earthquakes in the posts above occurring in the ice. If as was originally speculated the volcano was inflating would or would we not expect to see earthquakes??
Again i would like just to point out this is pure speculation,
brainstorming is you wish to call it something else. 🙂
I wouldn’t say there is “general consensus” but I wouldn’t rule out that possibility, either, or some combination of both things going on. You can only tell that the ice in the area where the GPS unit is located is falling, you can’t tell with any certainty why, it can only be a guess.
What we need is some volunteers to be dropped onto the glacier and to tell us whats going on. I go myself, but i’ve hurt my leg you see……….
So I take it that we are ignoring the LIDAR and GPR scans done last week end that proved that the caldera floor had sunk around 40 meters.
Tut tut tut…
Letting the facts get in the way of a good argument!
Hang your head.
I was not “having a go” just get frustrated some times as to why people read half of what’s posted, then decide to ignore what is posted by the experts. It’s great that we can all have our say and bounce ideas around, but I think it would be very foolish to fix an idea not proven in stone. We all learn here and I think it’s great that people with far more knowledge than us laymen take the time to explain and post here.
No, that LIDAR did not prove that the caldera floor has dropped. It proved that the surface of the ice dropped, it does not show WHY that happened.
http://jardvis.hi.is/maelingar_siginu_i_bardarbungu_med_flugvel_isavia_tf_fms_24_oktober_2014
Try again
Forgive me here i do no speak Icelandic, however using Google translator i do not see any mention that this is showing the sinking of the caldera floor.
If you look at the top two charts you will see a legend giving the dates the scans were carried out. If I remember correctly the first base scan was carried out in 2011 we’ll before any activity.
The next set we’re started on the 5 oct and the last was on the 24. Each scan shows a steady drop of the caldera floor.
I can see that, but how are you so sure this is the actual caldera floor? To me this appears to be a representation of the over all sinking be that glacial or ground rock.
Perhaps Jon or somebody else who speaks Icelandic could clarify what this is. Please?
I read and understand Icelandic and I´ve heard the experts say repeatedly that their professional opinion is that it´s the caldera floor that´s sinking. If you look at the evidence, this is pretty obvious, even to a layman.
There is lowering of the surface due to subsidence and there are also a few smaller cauldrons, which are caused by melting. The bottom line is, melting creates small localized cauldrons, subsidence affects the whole area, it´s deepest point is in one single spot, then it levels out gradually towards the surrounding rim. If you look at photos, you can clearly see the cauldrons, but it´s impossible to see the effect of the subsidence, because of it´s enormous scale.
I don´t have the time right now to look up the link with these photos from the latest flyover, they were posted here a few days back. Maybe somebody here has the link.
Nice graphics.
Seems important to me.
The height values of that graph correspond with the GPS measurements, if you check out the numbers. The color coding also indicates that this is about the ice ‘ground’ level. The final image shows the measured drop in comparison to the caldera floor.
The text with the plots reads:
“There were carried out measurements on the unrest area with the aircraft TF-FMS, ISAVIA airline, on Friday, 24. October. The subsidence in Bárðarbungu was measured on same measurement lines over the caldera. The subsidence was most NE from the middle of the caldera, around 40 m (see cross section). GPS measurments in the middle of the caldera show that the susidence is about 30-40 cm per day. The volume of the subsidence bowl is now around 1 km3.” (my translation, no guarantees)
“Farið var í mælingar á umbrotasvæðinu með TF-FMS, flugvél ISAVIA, föstudaginn 24. október. Sigið í Bárðarbungu var mælt í nokkrum mælilínum yfir öskjuna. Sigið er mest NA við miðju öskjunnar um 40 m (sjá þversnið). GPS mælir í miðju öskjunnar sýnir að sigið nemur um 30-40 cm á dag. Rúmmál sigskálarinnar er nú um 1 km3.”
Sorry, should read “some measurement lines” .
Thank you for your translation IngeB 🙂
SO2 has a similar structure to CO2 and therefore has the same modal molecular vibrations. It is a good absorber ( and correspondingly a good emitter ) of infra read radiation. The principal difference is when pushed into the upper atmosphere by volcanic explosion where sunlight blocking aerosols with water are formed. Plus the high level dust tbe net effect is cooling. In the lower atmosphere low level precipitation is stimulated drying the air. Dry air cools rapidly at night (think desert). When washed out as acid rain sulphates form.
@Scarface
Linking a document should mean having understood its own sense… No STRATOSPHERIC gas has been feeded to the stratosphere as far as now from Holuraun… Just TROPOSPHERE, where the whole sulphur/sulphite spectrum gases are greenhouse’s one.
Actually they have, very early infact in the eruption. I posted links from NASA satalites a few ago on here showing the SO2 at 8000 meters – this is the average level of the stratosphere in the high northern latitudes… The stratosphere can start as low as 7000 meter in the arctic.
To inflow the strotosphere with vulcanic gas you need an explosive eruption. There’s no other way to do it.
Atmosphere is a fluid and, as any other fluid, is in a continous mixing situation.
The two layers (tropo/strato) are splitted by the tropopause which is a REAL barrier (over that limit you have almost an isothermic gradient, slightly positive). You have to break that border if you want to feed something inside the stratosphere. What’s happening is that some local thermal flows are blowing few SO2 on the ceiling of the troposhere and there is accumulating a bit. Just like the condensed water on the lid of a boiling water pot.
After a major vulcanic eruption, you can find powder and gases up to 30.000 meters, not only 8000m.
I’m not sure if this has already been posted but I think it is a really interesting article/interview 🙂 http://www.visir.is/holuhraun-eruption-reaches-global-scale/article/2014141039805
Very good article. Makes things a lot clearer as to the size of this event, staggering is a word I would be tempted to use.
I agree, an excellent article. I tmade me laugh in a couple of places though; I suspect it suffered from translation, transcription or editing errors. The best was this quote “Ármann believes that the total volume of the lava field is now around a million cubic kilometers”. Now *that* would really be impressive!
I think we can begin to call it the Icelandic Traps.
PS: we are actually joking. The total volume of Holuhraun is anything between 1 to 2 km3, which although very large lava eruption, it is still 10 times less than the larger Icelandic lava floods, that happen every few centuries.
The current volume, 1 to 2 km3, just fits with the average Icelandic lava flood, which happens roughly every 100 years. And any of these Icelandic lava floods is larger than anything else on planet Earth.
It is the translation of the article I linked in with a resumee in English: http://www.visir.is/eldgosid-einstakt-a-heimsvisu/article/2014710319903
But good, to have it all. 🙂
For comparison: Puo’O on Hawaii produced around 4km3 in over 30 years http://hvo.wr.usgs.gov/kilauea/summary/ , Lanzarote’s 18th century eruptions produced roughly the same, ie. 3-5 km3 in over 6 years (from 1730-36) http://link.springer.com/chapter/10.1007%2F978-94-017-8628-7_23
It is of course 1 km3 (the error is also in the Icelandic version of the interview with Ármann Höskuldsson), but Magnús Tumi Guðmundsson says it correctly here: http://ruv.is/frett/staersta-gos-sidan-i-skaftareldum
(I’ll resume the text later on, but perhaps RÚV will also come with an English translation.)
And none of that compares to what bardabunga is capable of.. 21-30 km3 was it’s largest eruption since the great iceage. :-0
Compared to that it’s only child play. Just as a sidemark, but maybe more importantly, is it known how much time it took to produce the beforem. volume?
It is a lava flow, about 8.600 years old. I don’t know if the time span that it took to erupt this lava is known. As far as I remember, some years ago, it was even not known where this lava came from.
The lava flow (around 21 km3, but as it is covered by younger lavas and tephras in many places, this is difficult to say) is called Þjórsárhraun or Thjorsá Lava/ Þjórsá Lava /Thjorsarhraun (it depends). http://en.wikipedia.org/wiki/%C3%9Ej%C3%B3rs%C3%A1_Lava
It depends on the language you use, but the original Icelandic name is the first – and actually correct one, of course.
However that lava flow is considered to have originated within the bardabunga fissure zone, much like the curent fissure is.
http://en.vedur.is/media/jar/Bardarbunga_kafli20140825.pdf
Let’s talk about some estimates and facts:
Laki, 15km3 lasted 6 months. Rate was roughly 2km3/month
Edgjá, 15km3, lasted 6 years. Rate was roughly 2km3/year
Skjaldbreidur, 20km3, lasted a few decades. Roughly 1 km3/year.
These eruptions can last for long periods, but of uncertain variation between a few months to several years.
Holuhraun already erupted 1.5km3 in 2 months, so having a rate 0.75km3/month
Of course. As it is Brynhildur (Brünnhilde, Brunnhild, Brünhild etc. etc.), may be inspired by the Visigothic princess Brunhilda of Austrasia, possibly born about 543 in the Visigothic capital of Toledo (now Spain), the younger of the two daughters of Athanagild and Goiswintha. And later married the wrong person, but that’s another story.
@Irpsit. Yes, these are very big effusive eruptions in Iceland, that you name here.
But the “facts” are a bit different.
The Laki eruption (Grímsvötn volcanic system) took more than 8 months til it was over, from June 1783 to February 1784. http://wayback.vefsafn.is/wayback/20041129153805/www.ust.is/Frodleikur/Fridlystsvaedi//nr/1129
The Eldgjá eruption (Katla volcanic system) is often said to have lasted from 930-36, but as far as I know this is not really certain, sometimes it is also 934-36 etc.
And Skjaldbreiður was built up during longtime eruptions sometime around 9.000 years ago at the end of Ice Age, but nobody knows if this took 10 years, some tenths of years or over 100 years and if it was continuously or with intervals.
So that it is impossible to know the yearly production rate of neither of these eruptions.
@Porsche928. Nice that you mention Brynhildur.
Brynhildur at the moment is a medium popular female first name in Iceland, acc. to Wikipedia, there are at the moment 360 Icelandic women with Brynhildur as a first name, and 22 with the same as a second name. http://is.wikipedia.org/wiki/Brynhildur
And for the story with it, see eg. http://en.wikipedia.org/wiki/Poetic_Edda#Heroic_lays
Holuhraun is probably around 1.4-1.6 km3 or something like that. At least estimating from the rate of eruption.
But as lava field does not enlarge but rather grows thicker and taller, estimates based on that are much harder. So it is better to just estimate the volume by assuming the more or less constant rate of eruption, since the beginning.
Rate is about 0.025 km3 per day, but it was slightly larger in the first few days.
We’ll it would take awhile to get to the mil mark, but even so the speed it has ejected the amount it has is pretty impressive. And as said, how long this goes on is anyone’s guess.
If this continues into Springtime, (new growth) will continued emmision of so2 be a concern regarding Icelandic vegetation?
Would be grateful for any comments. Thank you all.
Most of it will be blown out to sea.
A heavy earthquake on 5:41 UTC
Caldera shaking
This is an interesting blip that’s developing, It will be interesting to see if it irons out or we have a big shift –
http://snag.gy/rjrK3.jpg
The infrasound chart is going active too –
http://snag.gy/WnyGX.jpg
Just coming in something is developing by the looks of this –
http://snag.gy/GKfbf.jpg
It is happening again, must be tech fault hopefully? Jons webicorders are clear –
http://snag.gy/xJhZq.jpg
Wrt lidar/gpr The blue profile shows lidar, the surface profile of the ice. The black lines show ground penetrating radar gpr, the surface of the ground under the ice. The diagram at the bottom shows ice and ground profile. The height axes of all charts correlate with the black lines being gpr measurements too. These guys have a scientific reputation to protect. When they say its the caldera floor why do people ignore it.
Are you refering to the chart in http://jardvis.hi.is/maelingar_siginu_i_bardarbungu_med_flugvel_isavia_tf_fms_24_oktober_2014 ?
If so, I disagree with your interpretation of it.
I think the top part shows one lidar profile of the ice surface in blue, taken in 2011, and six radar profiles of the ice surface in black. The vertical scale is metres above sea level, from 1850 to 1930, a total range of just 80 metres.
The middle part is changes in height for the six radar surface profiles relative to the lidar one. Scale is in metres, negative figures show drop, ositive show rise. Inset is a map showing the line over which the profiles were taken.
The bottom part, as you say, shows bedrock (brown) and ice (blue) profiles with the black line showing the drop in the ice profile. Verical scale is metres above sea level, from 1000 to 2000.
Note that the horizontal scale of the top part is different to that of the middle and bottom parts.
I do not doubt that GPR has been used, but I do not believe that these charts show its results.
If you look again at the graft you can see that the drop on the top one is about 40 mts, not 80 as you stated. The graft shows the underlying bedrock starting just out side the caldera rising to the lip of the caldera then down to the base of the caldera and back up the other side. The top scan is with LIDAR and the middle scan with GPR. The GPR scans were only taken from the top of the caldera rim. If you match the 2 scans you will see that the amount of drop is about the same on both scans.
The translation says that the caldera is sinking at a rate of 30-40 cms a day. It also gives the depths of the caldrons as aprox 12 mts and 20-25 mts. If you look at the 3rd scan you can see the original ice height with the new height superimposed with the new black line.
Follow that up with the photos and you can see the slight dip in the ice plus the caldrons.
@Clive
I did not say the drop was 80 m; I said the vertical scale covered a range of 80 m. And the highest bedrock on the scan path is about 130 m below the bottom of that graph.
How do you know the scans were done with GPR? Where did that information come from, please?
I think it was around the second scan that it was mentioned on the IMO web site that they had brought the aircraft back from the med, It was pointed out that the plain was equipped with both LIDAT and GPR. There was many posts about this and some said it would not work and others said it would. A link to the same type of radar was given that showed the results of the GPR when it was used to map the bedrock in Greenland, so that seemed to end the debate about if it would work as it clearly worked through 1000+ mts of ice there.
In the RÚV emission http://ruv.is/frett/staersta-gos-sidan-i-skaftareldum , they summarize the eruption up to now. It is a very big eruption, but still the quantity of lava produced during the Skaftáreldar eruption (Laki) was 14x the one of Holuhraun. But also acc. to professor Magnús Tumi Guðmundsson, this is the biggest eruption since then. Measured in DRE, it is about 5-6 x the quantity of the 2010 Eyjafjallajökull eruption.
Acc. to more accurate measurements of the lava quantity, the expert says, that it is rather difficult to do that, because of 1) the big surface covered by the lavas, 2) the gas emissions hindering scientists to approach it with instruments and 3) the often impaired visibility. [I think, here, Magnús Tumi also means the weather conditions, snow storms etc.]
Re. the connection between Bárðarbunga and Holuhraun, the subsidence measures now about 40m x 70 km2, which is less than the calculated magma quantity within the intrusion + the erupted magma quantity. The most probable explanation for the subsidence is though a connection between the subsidence and the eruption in Holuhraun. There is still the possibility of an eruption within the caldera, which would cause a big jökulhlaup and a big quantity of tephra output, it is necessary to be prepared for something like that, says Magnús Tumi.
Thanks for posting the link Peter, I interoperate it the same was as you do. I do have a few questions if anyone can answer. 1 what does Breyting i Haeo translate to, this is on the left hand side of the second chart.
Also on the second chart we have the depth scale but there is no width scale in Km this would be most helpful. As far as I can see this still only relates to the subsidence of the glacier and has no reference to what is happening below the glacier and at the bedrock.
I think as you have said Peter if there was an eruption going on under the glacier or if one started it would not take long for us to see the signs.
Useful translator http://imtranslator.net/translation/icelandic/to-english/translation/
Breyting i Haed = Change in height
Middle part horizontal scale same as bottom part.
Dave McGarvie @subglacial · 44 seg Há 45 segundos
#Bárðarbunga #Holuhraun. Latest official update. Basically, everything is at a steady-state. http://avd.is/en/?page_id=352
Like a patient having poor vital signs but not getting worse,”serious but stable”,the only problem is it’s an illness the doctors have never seen before ,so it’s almost impossible to predict what the future course of the condition will be and the timeline.
So we need a “doctor House” of vulcanology then…
…someone that can figure it all out before it is too late…
😉
Temperature of the lava is good, where higher is better. Pretty vital signal for a well-monitored patient.
Now it’s a 5.4
02.11.2014 16:05:41 64.691 -17.402 4.7 km 5.4 99.0 8.2 km NE of Bárðarbunga
Univ. of Iceland @uni_iceland · 9 seg Há 9 segundos
Photo from 29/10. Tephra fall evident from dark curtain hanging below the plume. Credit Morten Riishuus #Holuhraun https://twitter.com/uni_iceland/status/529252522029232128/photo/1
Would’nt that indicate a strombolian plume – and it also looks like that on this photo, I think …
Wouldn’t that speak against Ármann Höskuldson’s theory that the material at Holuhraun is coming mostly from the mantle and more for Magnús Tumi Guðmundson’s and IMO’s theory that most of the magma still originates from Bárðarbunga, ie. inclusion of more viscous material?
Thank you, Luisport, this is interesting. 🙂
I’m happy you like it! 😀
Reminds me of Etna http://www.meteoweb.eu/wp-content/uploads/2014/03/etna.jpg and Popocatépetl (Mexico) http://cdn.citylab.com/media/img/citylab/legacy/2013/05/14/popocatepetl%20volcano%20erupting%20eruption%20mexico%20city%202013%20may%20shelter%20ash%20disaster%20REUTERS___.JPG
BTW the last one is also a high quantity sulfuric gas producer.
Maybe recycled magma that is falling back into the crater and being thrown out with the eruption?
??
http://www.ncbi.nlm.nih.gov/pubmed/25069064
@Porsche928
There doesn’t appear to be any info on the suspected duration of that huge magma flow, at least not in English that I can find. Also a lot of the magma is now buried under new magma from various other eruptions of multiple sources.
I wonder what bardabunga’s largest ever eruption of magma was? I guess we will never now as the landscape is forever changing with old lavas being buried.
There is no magma that is now buried under new magma. Once it reaches the surface it is lava.
Monday
03.11.2014 12:59:36 64.622 -17.427 12.1 km 4.2 99.0 5.2 km ESE of Bárðarbunga
Monday
03.11.2014 12:53:02 64.682 -17.459 7.9 km 3.8 99.0 5.7 km NE of Bárðarbunga
RE: the measurement of subsidence as was kindly posted earlier today.
Now I like to get my facts right, so please jump in and tell me if I am wrong
Looking at the charts we can confirm the following.
1 From 2011 the top of glacier has subsided a total of 40 mtr’s
2 Since 2014-9-05 it has subsided 25 mtr’s (we have no data between this date and 2011).
3 We can see that the charts are running N-S and see that the area that we are talking is about 6Km in length/span, with the most subsidence at the north end.
Now someone posted a nice link that mentioned that the subsidence are was about
70M2Km X 40 M.
Now where am I going wrong ? why are they using 40 mtr as the subsidence as this was from 2011 I would think we should be using the 25mtr when they started monitoring it. and I would not be looking at an are of 70M2 km I would look at a lot less than that because it has not all subsided the same in every area. All I am saying is
I like to get my facts correct so you can look at this with an open mind.
Simple. When you saw that 70 square kilometer x 40 meters a few posts ago, it was attempting to provide an upper limit too the max volume of magma that left the caldera. Then pointing out that there is more magma in the intrusive dyke and erupting at holuhraun than could have possibly left the caldera.
Yes there are no data points between 2011 and 9/5/2014. So we also don’t know if the surface rose up (inflated). Before the deflation started. For all we know it inflated another 5-10 meters before the dyke formed and deflation started. All we have is the original baseline to compare against. But considering how long volcanic events can take, even if the deflation started in 2012 or something, its still likely part of this eruptive cycle. So its quite a safe assumption to count 100% of the deflation as part of this eruptive cycle.
Jon, I never said that super eruption or super volcano are scientific expressions. Somebody else put up that rather useless discussion. This is a blog of mixed audience, with more or less background in geology or volcanology. By the way, I just looked up a paper which was published in an international scientific magazine and there was used the expression of super eruption. No need to further talk about this, as this blog is not about nomenclature but about the current eruption in Iceland. Looking forward to your next report, as the webcams are pretty disturbed in the last days, and information scarse. Keep on the good work! This eruption is a real milestone, I was waiting for a Krafla style eruption since many years, and now this! Fantastic!
I thought you brought up some valid points,all that is needed for a caldera eruption ,is a large volume of magma at shallow depth,many seem to be confusing a caldera with a Strato volcano and with a conduit,were magma rises up the conduit blasting out the volcanoes vent plug causing an eruption.If there is and it is not certain ,a shallow deposit of higher silica magma under this caldera,all that is needed is a large volume of basalt to rise and trigger this evolved magma into eruption.The basalt is not in short supply in Iceland but the evolved magma is far less abundant?
VEI8 (minimum 1000km3 erputed material) is generally recognized as a Super eruption. Caldera size typically more than 40-50 km wide. (The Toba caldera is 130km long)
Is not Toba a caldera complex,encompassing multiple calderas?The point was a caldera event erupting a large volume of tephra,that could be a few km3 and a lot caldera eruptions are smaller in size,yet some immediately bring up the massive prehistoric eruptions of hundreds and even thousands of km3 and distort the discussion.
Mila cam 1 and 2 working again
The eruption is very active in cam2!
It’s just me of we can see smaller lava fountains to the right of volcano eruption and in the center of image?
That is just lava field glowing.
It has been a single vent since mid September.
Report from Iceland is this: gas pollution continues downwind the eruption, now near where I live, but not yet reaching high levels, which are forecast for tomorrow. Everything seems the same.
I think it’s the lava thrown over the edge sometimes
Spatter vents: http://volcano.oregonstate.edu/spatter-vents
Thank you for the comments! Cam 2 is impressive today!
My grandson asked me a question today, one that sadly my maths are not good enough to work out so I ask it here. If this eruption had built up as a classic volcano cone (something like Vesuvius and I know this could never happen as its the wrong type but humor a seven year old) how high would the cone be with all the material that has been ejected to date.
Good question Clive and credit to your Grandson…I’m guessing one Km but there are some seriously clever people on here who I’m sure will calculate it to the nearest metre!
Très grossièrement, en supposant que l’angle au sommet serait de 90° compte tenu de la viscosité, on peut appliquer la formule du volume du cône : (pi/3) x h x r = volume.
h et r étant égaux dans l’hypothèse de l’angle au sommet, on a :
(pi/3) x h x h = volume. Le volume étant supposé aujourd’hui de l’ordre de 1,5 km3, on a donc une hauteur de l’ordre de 1200 m pour un diamètre de l’ordre de 2,5 km. =>
if Vesuvius style, Hight : 1 200 m
Around 1,1km high if you assume 45 degree angle of the slopes and a perfect round cone-shape.
May help.
http://www.calculatorsoup.com/calculators/geometry-solids/cone.php
Wow, I was close !
That is impressive, and in 2 months or so. Will pass this on to my grandson, he will be well pleased with this. By the way he told me today that when he grows up he wants the work on volcanoes. Love him.
Monday
03.11.2014 18:06:47 64.683 -17.466 7.0 km 4.4 99.0 5.6 km NNE of Bárðarbunga
Big quake!
@ Enno
From another discussion board.
This should be exactly, what you were looking for.
https://www.facebook.com/134267477529/photos/a.178135392529.122079.134267477529/10152642211222530/
Skinandi-falls and Svartá-river
Yes, that looks good … many thanks!
Monday
03.11.2014 21:49:26 64.679 -17.516 7.1 km 4.6 99.0 4.4 km N of Bárðarbunga
Monday update for Bárðarbunga volcano is up. 🙂
Reports of irritation of the lungs, very bad thing, and those people should be wearng PPE.
There is possibly one grand plan to help, with all the geothermal energy, especially near to the event large fine misting water cannons could be constructed to spray the area. Not to put out the fire but to trap most of the gas.
This would be a grand project that the Iclanders along with international cooperation could achieve.
If we recall locally it has been recommended to turn on the showers in the home. Basically the concept and the science is to convert the gas to acid rain once trapped and falls to the ground in would wash into the ocean and be diluted.
Maybe it is time for a solution so here is the first idea lets brain storm…