
This update is going to be a short one. Since not much change has taken place in Bárðarbunga volcano since yesterday. Activity continued in Holuhraun same as yesterday, there was a new video of the erupting crater in ten clock news at Rúv. It showed the same lava lake that is now erupting and the lava river flowing from it. The video can be viewed here, it starts at 14:21.
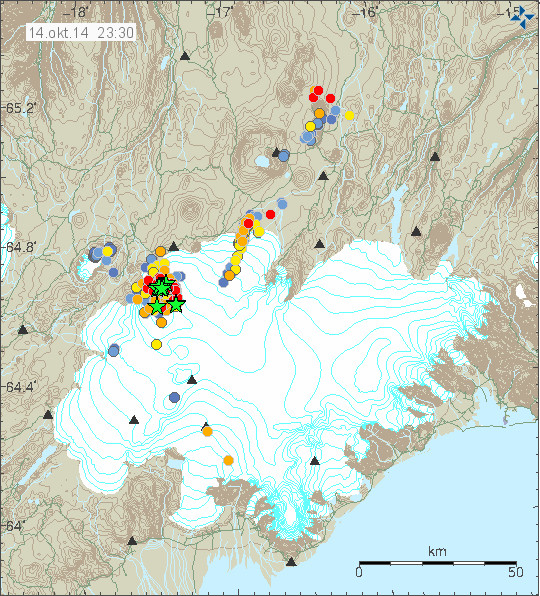
Earthquake activity on 14-October-2014 in Bárðarbunga volcano. Copyright of this image belongs to Icelandic Met Office.
Earthquake activity has been same as it has been for the past one month (about). Largest earthquakes had the magnitude of 4,8 and several magnitude 4,7 earthquakes took place. Other earthquakes have been smaller in magnitude. Harmonic tremor has been unstable, suggesting that minor eruptions might be taking place under the glacier. At least something is going on under the glacier, what exactly is not clear at the moment.
THANKS, Jon.
Even your brief posts are better than zip, nothing.
Evidently the videographers are not near as interested in where the lava field meets the river as I am. LOL.
I hope there’s enough clear days for SOMEONE to post some shots of that.
Did you see this?
http://www.dailykos.com/story/2014/10/05/1334562/-B-r-arbunga-Putting-The-Squeeze-On-The-River
National Geographic article about the eruption with pictures.
http://news.nationalgeographic.com/news/2014/10/141013-iceland-volcano-bardarbunga-lava-science/
Have been pondering the rifting comments. That’s been an interest of mine from the beginning.
Jon, et al . . . what are your guesses, expectations on how that will show up when the dust settles . . . i.e.
1. How much rifting will be evident extra to what was showing say 1 Aug?
2. Do y’all expect new volcanoes from such or more likely some old ones waking up or what?
3. Are there specific areas where more fissure eruptions are most likely as a result of wider rifting? If so, where?
4. If I understood correctly, folks are saying that the evidence is that the European/Asian plate is moving NE MORE than the North American plate is moving West. Is that right? And that IF the Eurasian plate WERE moving more East, then the rifting would be wider and faster???
5. I realize that the Sumatran quake that was sooo devastating is in a very different geology . . . However, thinking about that undersea cliff that appeared several hundred feet high more or less within minutes or so . . .
IS THERE ANYTHING remotely possible in the Icelandic rifting zone that could be THAT dramatic and sudden?
6. My assumption is that the rifting means new rock, ground wells up, flows up from deep within the mantle, the hotspot, both . . . and continually adds to Iceland’s surface area–particularly when on the coast. Yet, I had a ?silly? notion when looking at one of the maps of the rift areas vis a vis the Mid Atlantic Ridge . . . I wondered if it were remotely possible that the main island of Iceland could ever split apart???
I guess that’s all of my ‘absurdities’ at the moment. But I’d be interested in the comments of those of you who know far more than this layman about such things.
Curious, anyone else notice the short spikes on this chart are getting a lot more frequent?
http://hraun.vedur.is/ja/vatnajokulsvoktun/grf_trem.html
Yes, low frequency activity is increasing and that is not good news. I am not sure what it means, all I know when it comes to volcanoes this type of activity is never good.
I have now moved away from smart mobile phones to “feature” mobile phones. So I don’t know when if an earthquake swarm starts if I am outside (no good web browser on the mobile phone that I now use).
More on this later on my other website (so I won’t go off-topic my self here). 🙂
Comment updated at 03:41 UTC.
Jon, I’m ignorant of where your other website is???
I use this website for other things.
http://www.jonfr.com/
Hi Da Xin. The Indonesian quake of 2004 was caused by plates pushing together where one plate subducts under the other. What happened was that the top plate got stuck on the subductiong plate and was slowly being pulled down and building up stress and energy like a coiled spring. Suddenly the top plate sprang back up on a wide front lifting the ocean above it several meters in one go thus generating the tsunami. The mid atlantoc ridge is plate spreading caused by convective currents in the mantle. Usually the process is quieter as in takes place with less energy stored. However on occasion rifting increases on a large scale producing flood basalts like the Deccan steps or to a much smaller extent, Laki.
THANKS Andy.
I thought that was the case . . . I just wonder if there’s ever been any evidence of a rifting action that was also relatively fast and dramatic . . . and if such could occur in Iceland.
Evidently not.
I guess I keep having the . . . feeling, intuition, something . . . that our era is going to see a LOT of unprecedented volcanic and quake events. I realize that will come across as irrational to many. However, when that inner impression gets to a certain level, it virtually always comes to pass in some significant way or another. Time will tell.
We’re starting to experience some rapid and unstoppable deglaciation, e.g. in the volcanic province of Antarctica, so you could well be right since the correlation between deglaciation at the end of the last ice age and shield volcano formation is well established. IngeB posted some good stuff about that re Iceland awhile back.
Wial,
I don’t believe I have seen any data supporting that claim. Climate alarmists, have sadly, attempted to publish papers supposing this, but to my knowledge every paper has been debunked or withdrawn.
Furthermore, recent record cold combined with record high levels of ice indicate that once again alarmists are 100% wrong, they even usually get the sign wrong. Jón’s blog is about volcano’s, let us stay on topic.
@DontGetOutMuch You’re the one going off topic.
If you reread my comment you might discover it was in fact about volcanoes, and yes, a lot has come out in just the last year re the situation in Antarctica.
I really do try to avoid bringing up the subject of climate science on this blog, but in this case it was unavoidable as it pertained to the issue at hand.
You’re claiming Eric Rignot’s (et. al.) paper http://www.nature.com/ngeo/journal/v1/n2/abs/ngeo102.html and summarized here http://www.scientificamerican.com/article/melt-of-key-antarctic-glaciers-unstoppable/ has been withdrawn or debunked. I’ve seen some blog entries attacking it, but those don’t count re science proper. It has over 500 citations.
Please stop.
Da Xin,
You’re watching a “rifting action that was also relatively fast and dramatic” right now! Sorry if it’s not fast enough or dramatic enough for you! 😀
And we ARE expecting a higher level of activity over the next couple of decades, perhaps more. This is no secret, has been discussed for a long time; Icelandic volcanism is known to have be somewhat cyclical.
& to Wial,
PLENTY TRUE! LOL. Thanks.
I think it’s still lower key on such scores than what my “gut” tells me will be the case. Hope I’m wrong.
Something is happening at http://hraun.vedur.is/ja/vatnajokulsvoktun/grf_trem.gif and http://hraun.vedur.is/ja/vatnajokulsvoktun/dyn_trem.gif, but what is it?
Just been having fun on the IMO website http://hraun.vedur.is/ja/Bardarb/bbbeginman24h/images.html
If you roll the mousewheel you can animate the EQs. It appears to me as if the EQ swarms rotate anticlockwise with increasing time. At first I thought the magma under BB is sinking and emptying from the chamber like the kitchen sink emptying and swirling around. However if subject to the coriolis effect the anticlockwise direction is consistent with magma rising for the northern hemisphere assuming the lid is trying to turn in the direction of swirling magma. Probably some other effect or just a figment of my imagination but what do you think ?
You know this link?
http://hraun.vedur.is/ja/quakes3d/
It is loading a while, but then you can see all quakes from 16.8.-08.10. (don’t know if they update it sometimes). And you can play with it a little bit…
At the right side you can choose the “timelapse” (right word for this?).
Above you can choose the starting time…and more other things…
It is from this site and here are some instructions for the use.
http://en.vedur.is/earthquakes-and-volcanism/articles/nr/2971
Where is Husbondi (HUS) station located? Seems kind of shaky… And the same pattern is picked up by dyn, von and skr stations. But its seems strongest in Husbondi…
http://hraun.vedur.is/ja/oroi/hus.gif
It is located just south of Grímsfjall volcano.
5.4 EQ Iceland – drumplots http://hraun.vedur.is/ja/drumplot/allarsort.php going mad
Wow, this really is a big one. Probably around 5.7??? But at what location?
Why isn’t it showing on Böðvarshólar webicorder, Jon?
It semms it was @ west side of vatnajökull
Grimmsvötn?
http://earthquake.usgs.gov/earthquakes/map/#{%22feed%22%3A%221day_m25%22%2C%22search%22%3Anull%2C%22sort%22%3A%22newest%22%2C%22basemap%22%3A%22grayscale%22%2C%22autoUpdate%22%3Atrue%2C%22restrictListToMap%22%3Atrue%2C%22timeZone%22%3A%22local%22%2C%22mapposition%22%3A[[64.00727487517712%2C-19.017333984375]%2C[65.06055135846069%2C-16.380615234375]]%2C%22overlays%22%3A{%22plates%22%3Atrue}%2C%22viewModes%22%3A{%22list%22%3Atrue%2C%22map%22%3Atrue%2C%22settings%22%3Afalse%2C%22help%22%3Afalse}}
There’s a green line at the time, no data coming in, hence not showing on the top plot
nerver mind the link before …
Imo said 5.4 @ bardabunga, usgs said 5.1 more south west :http://earthquake.usgs.gov/earthquakes/map/
GFZ Potsdam says even mag 5,6!
64.59°N 17.69°W Depth: 10 km (!?)
Dunno what data they use.
Looking at the Mid Atlantic Ridge on that map . . . it’s almost like the hot-spot functions as this sort of huge ‘concrete’ pole that the MAR bends around at Iceland. LOL.
There have been a number of rift jumps in the past because the rift is trying to hold its position over the hot spot. And that’s also what we are seeing now: a rift jump in action from the WVZ to the EVZ, but this is nothing really new, it began 3 mill. years from now.
http://hal.univ-brest.fr/file/index/docid/480715/filename/Garcia_4_.pdf
See also Einarsson (2008)
BTW:Surtsey, on the included map is a bit big and the rest of the Westman Islands is lacking. (The biggest island is Heimaey).
The Westman Islands actually could become part of a new EVZ rift.
And the next rift jump is also in preparation: From the EVZ to the ÖVZ, ie. Öraefajökull – Esjufjöll – Snaefell (again more to the east).
The traces of these rift jumps (ie. movements of the MAR) look a bit like the traces of the Yellowstone hot spot: Th. Thordarsson, Chapman 2012, p.2
http://www.agu.org/meetings/chapman/2012/bcall/pdf/Chapman_Outline_of_Geology_of_Iceland.pdf
P. Einarsson (2008): http://jardvis.hi.is/sites/jardvis.hi.is/files/Pdf_skjol/Jokull58_pdf/jokull58-einarsson.pdf
M 5.1 – 124km NNE of Vik, Iceland
Time
2014-10-15 13:16:33 UTC+02:00
Location
64.447°N 18.044°W
Depth
10.0km
Less mag, different location, same depth …. hmm …
If i watch @ the drum plots, they suggest that the center was more southwest of bardabunga.
Forget what anyone but IMO report. It’s been mentioned again & again that USGS, EMSC etc all use automated quake plotting, where as IMO are manually confirming the large quakes to give accuracy for plotting where they are occuring. You get a multitude of reports for every quake. All different depths, magnitudes and locations. Only IMO matters.
Magma getting closer to the surface at that NE rim?More heat is able to reach the surface,so fewer large quakes in the surrounding rock,increase in small volcanic quakes should become more apparent as well as increase in tremor?Increase in hydrothermal activity,more ice cauldrons and cracking of glacier?Now will it follow this script?
From IMO:
A M 5,4 event occurred in northern Bárðarbunga at 11:16. It was felt in Akureyri. The GPS- sensor at Bárðarbunga shows a drop of approximately 15 cm during the event.
So weather doesn’t seem very bad, but tremor plots look interesting. Lots of increased intensity near the event, and the f2-4 Hz line seems to be traveling on quite a few. I can only note this seems different than weather related stuff I’ve seen, but interpretation is for the more knowledgable…
Curious Curt
It seems like IMO has given up on verifying all the smaller EQs.
Maybe still recovering from the soccer match 🙂
Which comes first – The EQ or the drop in caldera?
There should be a noticeable depression where the GPS is sited as it has dropped 14 metres since installation.That is the height of a 6 storey building and yet no pictures?
it’s already been proven that the caldera is collapsing.
@Tyler Mannison
…an what did he say? “it (the GPS) has dropped 14 metres since installation”.
Whats wrong with that? Could you please (both) stop your personal competition about some words? It’s boring…and annoying…
Yes Tyler, but the ice should follow the deformation of the floor,so there would be visible evidence on the surface one would think?
@mafl @Tyler Mannison
I think TM was replying to a question underlying what GS said, and his reply seems to me intelligent and legitimate on grounds that are respected and well-established, relative both to the duration of this event and to the period that GS has been observing it (unless there have been several GSs on several blogs).
Unfortunately, it can take some time to discern what’s truly “boring” and “annoying” (and often misleading, too). As with most trolls when they open their mouths, it’s usually better not to feed them.
OK, I’ll rise to the bait. Or rather, I’ll let a great volcanologist speak for himself: http://vulkan.blog.is/blog/vulkan/entry/1467678/
But doubtless, being a vigilant type, you will already have seen this… But what do I know?
If you really had read Haraldur Sigurdsson’s text (do you speak Icelandic – because in Iceland Review, its just part of it), you would have seen that he says that the most probable outcome would be that the subsidence and eruption stop after a while, months perhaps. But he also says “margt getur komið fyrir, sem ruglar svo einfaldaða mynd” – in English: “a lot could happen which could mess up such a simple conception”.
And also: Could you please leave Geyser Soze alone. She is just expressing some alternative ideas in a very complicated geologic context. And this is absolutely legitimate!
@IngeB
Já og nei! I speak a tiny bit of Icelandic (and have been mistaken for a native speaker!).
The reason I posted the link (to Haraldur’s blog, not the Icelandic Review, btw) was because GS seemed to me (and to TM, I think) to be seeking to cast doubt on the opinion that the caldera is subsiding. Since Haraldur’s views are amongst the most respected there are, I thought they might quell GS’s apparent difficulties with the opinion that subsidence is occurring and show that his/her comment and question are misplaced.
I agree, much in this event is very complicated – particularly for people like me who know very little indeed about volcanology, but with all the data that have been made available, doubting that Bárðarbunga’s caldera is subsiding is like my doubting that a real person has replied to my earlier post!
Regarding the way some people have responded to GS… Well, I’d rather say it to you in a private email than in public, but GS was identified as a troll by the moderators of another volcanism blog that many scientists frequent. S/he was given several chances to change his/her ways, but has recently been banned from that blog.
The gps has dropped 14metres or so and unless there is real time correction of the chart using data that is actually measuring the caldera floor movement and not the ice,the gps is measuring any the movement of the ice.Initially before the gps was installed photos were release showing fracturing of the icecap,I was pointing out that I have not seen any photos showing any development of fracturing or any extra ice cauldron development.As for what the scientists say ,they will give what they think is the most likely outcome known at this time,that does not mean this is the only potential outcome.The reason that their scenarios have not changed is that nothing has happened in the last month to cause them to doubt the probability of their stated outcomes.
This situation could change at anytime and I would guess they have formulated other scenarios to announce ,should these changes occur.
Out of respect for the integrity of this blog ,I shall state my opinion(no inference is implied that what I say is factual,it is opinion for the point of discussion) on this subject and will not respond to any personal attacks or attempts at provocation.
I should learn from you, Geyser! Ironically, I tend to think of my own detractors as “the usual suspects”, which does perhaps help blunt the intensity of my moral outrage when feeling falsely accused.
But I came here to say I didn’t read your OP as skepticism about the veracity of the data, but rather, a hope to see new pictures out of curiosity about how it all looks, a curiosity I share.
In the interest of universal peace, in case anyone missed it, here’s a lovely photo of one of the cauldrons, from early on http://glacierhub.org/wp-content/uploads/2014/09/cauldron-Dyngjujokull-source-Almannavarnir.jpg (source: Almannavarnir)
That is precisely what I meant wial and it could be that the ice is not showing changes that would be obvious in photos.
The explanation I got when I asked a similar question was first the earthquake as a support snaps, and then the drop.
Sometimes we get an EQ with no drop. Sometimes we get an EQ and a rise (!) sometimes we get an EQ and a drop. But what I *have* noticed is that most drops are preceded by a rise. Notice that for about 6 hours before the 5.4 quake there was no drop at all. It was pretty flat. I believe this was because of gas building up under the ice. Then we get a 5.4 quake, things shake, the gas escapes (the caldera “farts”) and the ice drops suddenly. Notice also that prior to the previous drop we saw several hours of a general rise with a sudden drop without any quake at all. Again, I believe that is gas building up under the ice and then finding an exit.
I believe we are seeing inside the caldera the classic pillow lava extrusions that are very common in subglacial eruptions. The difference in this case is that the water from melted ice can’t escape the caldera and the ice above it keeps the water cold. The times when we see a nice linear drop is when there is no active extrusion taking place and the ice is melting water around the recently erupted lava pillow carries the heat up to it. When we see a rise or “flat” GPS activity, is when there is an extrusion or a significant injection of gas (or both) into the caldera.
The eruption might not last long enough to melt the ice all the way to the surface. The longer term hazard is one where water interacting with volcanic gases becomes corrosive and acts on the rock on the caldera rim. This weakens the rock and at some point there could be a failure of the caldera rim allowing the ice and water to leave quickly. That would truly be a catastrophic flood.
The Caldera farts! Crosspatch you’re getting too technical for me 😉
Not sure if this video had been posted before – it’s outstanding
http://vimeo.com/108991081
Very beautiful pictures, thank you for posting. 🙂
The good old Knof-Hof show, isn’t it? Thx for posting…
Love the scenes with heat distortion in the air.
Yes I also don’t understand why we don’t have any updated pictures of the caldera subsidence and the other bowls they found weeks ago?!
The flights are expensive and it has been foggy. Even on days when we could see the eruption from the cam, it might have been foggy up on the glacier.
There is often flown in the last days. Look at the many videos that have emerged in the last few days. Since you can sometimes fly over the caldera.
@Mike Schüler Are we talking about the same caldera? Not the fissure eruption, but the big one way up on top of the mountain. If the latter, would love to see some links!
Modis picture incl. the caldera, but I just see clouds here …
http://jardvis.hi.is/bardarbunga_2014
Flood water from Gjálp 1996 was in some point 50.000 m3 per second. Here is good video about that. Katla and Bárðabunga can reached 200.000-300.000 m3 https://www.youtube.com/watch?v=MgkEwIykTno
Awesome!
On the Gjálp eruption:
https://notendur.hi.is/~mtg/pdf/2003BullVolc66_MTGetal_Gjalp.pdf
BTW: The commentary at the end was not correct, as they said there would not have been warning signs (“ohne Vorwarnung”), the scientists knew for weeks that the glacier run would come and they knew also when it started so that they had the time to close the National Road no. 1, which was endangered and partly really destroyed afterwards.
I have fixed Heklubyggð geophone station and it is now updating again. I am not sure what the problem is at this moment. If this happens again I am going to look closer into this issue.
While the connection to my Böðvarshólar geophone station was lost when the magnitude 5,4 earthquake took place I did record the earthquake on that station locally and I was able to save it from there.
Tungnafellsjökull is on a roll
Well if this was posted before sorry, if not hope you all enjoy.
http://en.vedur.is/media/jar/Factsheet_Bardarbunga_20141013.pdf
Hi all.
For those lay people like me who are keen to follow the tremor graphs but find it a bit like looking at a foreign language. I found this paper which helped me understand the plots a bit better and understand what I am seeing. https://www.google.co.uk/url?sa=t&source=web&rct=j&ei=LbU-VI6kLYOkygP08YD4BA&url=http://www.giseis.alaska.edu/input/steve/PUBS/McNutt-EESS-tremor.PDF&ved=0CC0QFjAGOBQ&usg=AFQjCNFxTCBYmObsb8-2CjttrJuHlQJzDA&sig2=6_pLaY1q1Q3Cfsy1Q-Mn8Q
thought I’d share.
Thank you Ainsley.
Concerrning the caldera subsidience, while I think the caldera floor is sinking on par with the ice, which would explain the daily M5 earthquakes in the ring-faults….
Still we have no 100% confirmation that the caldera floor is actually sinking. We only know that the ice surface is sinking. Radar does not penetrate further down.
We have seen other cauldrons forming in other ice-covered calderas in Iceland, namely Katla in 2011, and no subsidience occurred as measured in the nunataks. It was the result of a subglacial eruption within the caldera.
Even though I believe in caldera floor sinking, we have no direct confirmation of it. Please be aware of this.
We need to have GPS installed in the nunataks of Bardarbunga. I can’t understand why they haven’t done it yet.
Ground penetrating radar goes under the ice, and the Icelanders use one. But I think it could just be both like you say in the beginning. We had this discussion before. Icelanders have ground penetrating radar, a close collaborator of Magnús Tumi Gudmundsson, the glaciologist Helgi Björnsson, said so in a lecture ( http://all-geo.org/volcan01010/2012/01/icelands-melting-glaciers-and-other-stories/ ).
But I don’t see the problem with this. Cannot the caldera sink, and at the same time magma stream into the intrusion and up into the caldera rim and heat up the caldera floor which is perhaps in a way “swimming” on it?
There was mentioned by Icelandic volcanologists and not only once, that more magma is streaming into the system that comes out in Holuhraun. So where would this magma be? Just in underground fissures near the bigger intrusion? Widening the intrusion? Could not also the caldera sink and heat up at the same time? There is not much relent in the continuous magma supply as can be seen at Holuhraun. Would not such a continuous supply of magma heat up the whole system anyway over time? And as magma is buoyant, it tends to go up, why not (also) into fissures within the caldera walls?
For me, there could be a combination of both processes be going on. But I am not volcanologist neither ….
What do you think?
But are they using radar in real time and correcting the gps chart to filter out ice melt and compression related changes?If so, should there not be a gps chart uncorrected and a chart corrected through use of radar?
I don’t think that there is any real time radar now near the caldera. They just did have radar during their flyovers within the aircraft.
And I don’t know, if they could use the radar we saw at Holuhraun for checking on the caldera. They anyway removed it from there recently.
In my opinion this is very much a temperature driven event,the very linear gps drop to me indicates a temperature driven underlying cause,otherwise it would be dropping more erratically.But the “experts” I am sure have differing opinions.
So they never found lake Vostok?
http://en.wikipedia.org/wiki/Lake_Vostok
http://de.wikipedia.org/wiki/Wostoksee#mediaviewer/File:Lake_Vostok_Sat_Photo_color.jpg
Maybe RADSAT-2 is still in holliday?
http://en.wikipedia.org/wiki/Radarsat-2
We can only enjoy the show…bit sad…but 🙂
Do we know for sure they don’t have sensors they aren’t telling us about or we haven’t noticed? Remember that article about the Cambridge research team, and how they were bragging about how many sensors they were able to deploy?
It does stand to reason they’d put some on the nunataks — although they might not tell us much about the caldera floor, per se.
There could easily be more devices in use than we know about, I think, yes. Seems very probable to me.
Also that the Icelandic scientists have made a lot of radar images during their last flyovers. And actually, – even if we are craving for material – they are not really obliged to “feed” us with it.
Problem is, there are no nunataks in Bárdarbunga. The caldera rim lies under up to 150 m of glacial ice.
It was because of this that they had to put the seismometers onto / into (?) the ice in the middle of the caldera.
Bardarbunga doesn´t have any nunatacs. It´s all covered over with ice.
Could have sworn I saw one or two
Maybe not the rim per se, but what about these guys?
https://www.google.com/maps/@64.6588669,-17.7009672,2363a,20y,90h,81.41t/data=!3m1!1e3
Why not put a gps where the rim is thought to be,at least that would give a comparison?
@Wial 22.44
That looks to me like some areas of “dry” glacier – ie glacier that is not covered by snow. Crevasses, with snow in them, are clearly visible, too.
For comparison, have a look at Grimsvotn a bit further south: that has nunataks.
Good evening all. With all this seismic activity going on around Tungnafellsjökull and Barda, the question is which one is going to go first.
@wial
according to this they can´t even get rock samples from it because it´s all covered over
“The caldera rims are also covered in ice, so we don’t even get some clues about the compositions of the volcanic rocks erupted here. And this is fairly important, because these rocks could provide clues on how the caldera formed.”
http://davemcgarvie.wordpress.com/2014/09/07/so-what-if-there-was-an-eruption-at-the-bardarbunga-caldera/
Yes, to the best of my knowledge, the rim of the caldera is covered with 85 to 150 meters of ice depending on location. The deepest point of the caldera is in the northeast quadrant close to the northeastern rim where the wall of the caldera makes a sheer drop. The deepest point is estimated to be about 850 meters below the rim, so adding another 85 to 150 meters of ice means that the bottom of the caldera is very deep under nearly 1km of ice. Consider this like a volcanic eruption of pillow lava under 1km of water — you will see no evidence of it at the surface at all. Inside the caldera would be basically a frozen lake which is probably thawing from the bottom up currently.
The depth of any vent inside the caldera would be about the same as the Lōʻihi Seamount off the coast of the island of Hawaii (and the sort of magma is fairly similar, too). That seamount is under 975 meters of water and frequently erupts with absolutely no indication of the eruption at the surface.
Wial . . . I couldn’t get Google to focus that image at all. Don’t know what I’m doing wrong. Tried everything I knew.
I think I once knew what a nunatak was . . . guess I’ll have to look it up again. LOL.
It’s mostly just white, and the resolution isn’t that fine. Bing isn’t any better, nor the National Land Survey of Iceland, although in that one it’s easier to conclude the outcroppings in question are probably ice, not rock, as Andrew says. http://atlas.lmi.is/kortasja_en/?x=597854.7685280954&y=483198.1473930675&l=4&anno=1&bm=2
Re nunatak:
http://en.wikipedia.org/wiki/Nunatak
Let’s just say you’ll need an anorak on a nunatak.
THX THX.
What’s up with the harmonic tremors at katla notable on the sill station “Esk”
Also how does one access the refined tremor graphs that I see linked in here?
That is wind and nothing else.
New article is up about Bárðarbunga volcano activity. 🙂