
This is the daily Bárðarbunga volcano update. If you wonder why I write this every day even if there are no major changes there is a reason to it. There is an eruption taking place and there is always something going on. There are more notes about other things at the end of this article.
Current status in Bárðarbunga volcano on 9-October-2014
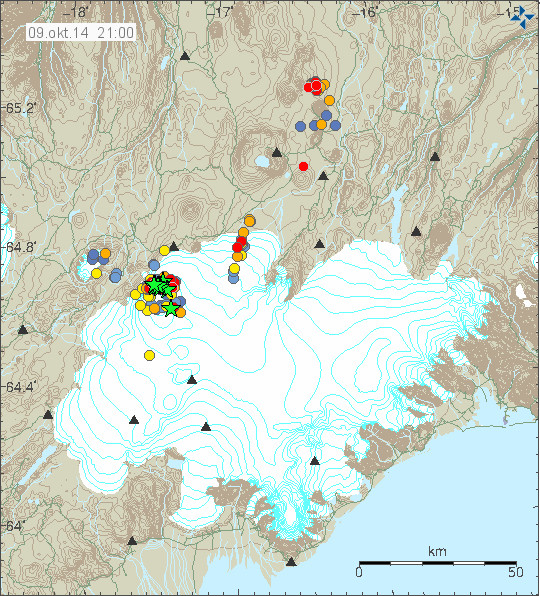
- Largest earthquake today had the magnitude of 5,2, it took place at 21:22 UTC. Second largest earthquake today took place at 04:37 UTC and it had the magnitude of 5,0.
- There is increased activity over the dyke origin area in Bárðarbunga volcano. Largest earthquake so far had the magnitude of 4,8 at 19:13 UTC today. I don’t think this is a good sign, since it appears to me that more magma is trying to get into the dyke. The dyke is however not wide enough to take in all this new magma that is trying to pressure its way into it. So it is now trying to expanding it at is starting point. If that expansion of the dyke fails the magma is going to start looking for new way out. What path the magma is going to go is not possible to predict. When the formation of new dyke starts, there is going to be a new earthquake swarm with thousands of earthquakes as happened from 16-August to 29-August when the eruption started.
- Bárðarbunga volcano caldera continues to drop even if the magma pressure is increasing. I don’t know why that is. The caldera is not going to collapse until most or all of the magma leaves the magma chamber holding it up. Until then it is going to stay up. When the magma finds a path out of the magma chamber it is going to start a large eruption that is only going to last 60 – 75 hours (less than a week). Until then it is going to be more of the same. New dykes forming and sometimes erupting.
- Bad weather has prevented me from seeing anything on the web cameras. I have also not heard anything about the lava field current status on the news today.
- Today there was more earthquake activity along the dyke then yesterday. Suggesting increased pressure in it, as would be expected since I am seeing more pressure in the magma system (based on earthquake activity).
- Nothing else to report far as I know.
The ring fault in Bárðarbunga volcano
The ring fault that has formed in Bárðarbunga volcano can clearly be seen on this image today from Icelandic Met Office.
The ring fault in Bárðarbunga volcano. Copyright of this image belongs to Icelandic Met Office.
Bárðarbunga volcano is a Stratovolcano (Wikipedia information can be found here) on a rift zone setting. This means Bárðarbunga volcano is able to erupt normal explosive eruptions at times (rhyolitic type eruptions), since magma can be mixed inside the volcano over a long period of time. I don’t think that is going to happen now, since there doesn’t seems to be any such magma in Bárðarbunga now. Since current activity happened without warning and that has not allowed any magma to evolve inside Bárðarbunga volcano magma chambers. As for Bárðarbunga volcano caldera collapse, information about how and why that is happening is explained here in general terms. As I said above, for as long there is magma inside the magma system that holds the weak area up it is going to stay where it is.
If anything major happens in Bárðarbunga volcano. I am going to write a new article or update this article with the latest information.
Other things
please note that I am in the process of moving back to Iceland. The moving date has been set in December. Until then I am just slowly packing my stuff down into boxes and ordering the transport for my stuff to Iceland. I am also trying to save up some money for the transport cost so I don’t have to take a large loan with my parents for this move back to Iceland. This also means that my geophone in Denmark is going down tonight. The website for it won’t go away right away. The image is going to be replaced with a test card.
Donations: Please remember to support my work with donations or by shopping at Amazon. Don’t worry about it if you can’t donate. I am just happy when I get any donation. Regardless how big or large it is. Thanks for the support.
Crazy theories
If there is a theory or idea that sounds just too crazy to be true. It is just that. Nature has its own rules and laws that it follows, even if we don’t understand them all. That is still what the nature does, even when it comes to eruptions. The best idea when it comes to crazy ideas is to ignore them. It is also important to know that nature ignores all crazy ideas anyway and does what it pleases to do. Regardless of any human idea about how nature works. I write this since I have been hearing a lot of crazy theories and ideas about Bárðarbunga volcano. Almost none of them have basis in fact, others are just twisting the facts and creating something unrealistic in the process.
Jon, you are very specific about a few things without making clear why that is (ie length of possible caldera eruption) and I read a lot of “that is not a good sign” on the last 1,5 month, which is very unspecific (not a good sign for whom or what in which manner?) . That is very unscientific and I would change that, because it is getting hard for me to follow your thoughts and take them seriously (ie why is your opinion for the caldera erruption changing so dramatically?)
Nature is not being clear on the clues what she is giving us in this matter. This is the most likely outcome. If you read the factsheets from authorities in Iceland on the eruption in Bárðarbunga volcano you are going to find the same amount of unsure assessment. Nobody, far as I know is going to know for sure what happens in Bárðarbunga tomorrow, next week or in the coming months.
There is a good chance there is going to be a large eruption. Clues have not given us anything else at least. When and how large it is going to be is not know and is not going to be known until it happens. What we know about large eruptions is that is they almost never last a long time. Good example of this is the 2011 eruption in Grímsfjall volcano, it lasted a week, but put out the total amount of the eruption in Eyjafjallajökull volcano in about two hour period. So we know how that works. Even if there is little idea what is going to happen between now and until it starts in Bárðarbunga volcano.
Volcano monitoring is far from being exact science and never has been. I guess it is never going to be exact science. Even if the science of it is going to jump forward with each eruption.
Civil Protection in Iceland factsheet for 8-October-2014. http://avd.is/en/wp-content/uploads/2014/09/Factsheet_Bardarbunga_20141008.pdf
Jon, it already IS a big eruption. Most voluminous in a long time in Iceland, and pretty big even by world standards – and it doesn’t show any sign of stopping soon.
This is a marathon, not a sprint. I don’t exclude the possibility of much more *violent* short-term events along the way, such as a central volcano eruption, but it’s already plenty big and getting bigger.
Yes, I know. This is the largest eruption in Iceland by volume of lava since 1947 and this is the largest eruption in Iceland since 18th or 19th century (150 – 250 years). I don’t know how this eruption compares on the global scale, since I don’t track those numbers.
Basically it’s just steady as she goes. GPS seems to show waves of deep magma coming and going, flexing the crust this way and that. This next wave will probably invigorate the current eruption with larger fountains for time, then ease off a little. I really don’t know how much more the crust of Big B can stand the stresses. Weeks on end of larger quakes with the last few showing more micro-quakes. The tenacity of this event is incredible!
My theory is that the magma chamber of Bardarbunga has drained and formed the current dyke along a previous weak zone, like the drainage of the lava lake of Nyiragongo in 2002, or the last important eruption in Kilauea; but this has happened at depth, and that’s why it’s subsiding now. If thats not the case I don’t understand where does the magma come from and why the pressure is supposedly increasing and the caldera subsiding at the same time.
I would be interested to know what are these”crazy theories”?Mike Ross is correct,this already has been a significant “voluminous” eruption,the indications are however that this eruption is symptomatic and not climatic.I would suggest that there currently is a significant body of magma involved in the current episode that currently is not eruptible .If that is a crazy theory then that is my prerogative.
If you look around on the internet you soon find what I am taking about. No, I won’t link to them.
I think contributing to that sort of speculation, is what seems like a lack of elaboration over the past month by the IMO on their potential scenarios,a lot of extra data must of been gathered over the last few weeks but no new information has been forthcoming?
They share as much data as they can share. Understanding of that same data is a different matter.
Here’s the sunset at Bakkavör Marina in Seltjarnarnes, Iceland tonight:
http://i.imgur.com/8B3b0T2.jpg
That SO2 sure is great for photography! WOW!
I had to reboot my computer and goofed and didn’t save the link to the more or less constantly updated (on refresh) cumulative GPS graph that shows the steady downward slope.
Does anyone have that handy? I’ve looked on dozens of pages and half a dozen sites and haven’t found it. Sorry for the bother.
I’m using this one http://hraun.vedur.is/ja/Bardarb/BARC/
RIGHT. THANKS. That’s the one. Now I have a shortcut on my desktop to it. Need to relable it so I know what it is. LOL.
Here’s a crazy theory. Actually theories. I’m looking at the subsidence graph and right now there’s still a clear tightly correlated signal of subsidence at the exact time as the 5.5 quake on the 7th. And that’s hardly the first time that’s happened. As someone posted previously, Dave McGarvie says even large movement from actual changes in the caldera/ magma chamber can take days to propagate,
e.g. https://twitter.com/subglacial/status/519843672196935681
“A 1 km2 #Bárðarbunga caldera block suddenly dropping 1 m would be registered a few days later as ‘background’ subsidence by ice-surface GPS.”
So why the immediate response? I find it nearly impossible to believe something like this: http://i.imgur.com/m180Ba8.png is pure coincidence.
So if it’s not movement due to the original event of rock shifting hundreds or thousands of meters below (presuming McGarvie is right and I’ve understood him correctly), could it be the shockwave (maybe the P wave?) is causing the surface ice to compress like a soufflé dropping? If so, it would have to inflate a bit again afterwards (relative to the overall continuing subsidence) for it to happen repeatedly, as it has been doing. Maybe not so much inflation as stretching as the ground recedes below, only to crunch back together again at the next big shake?
Put another way, is the surface ice acting as a giant seismometer? Or is this something akin to Raleigh waves or Love waves?
If not, what else might explain the immediate reaction registered by the GPS to a few of the large quakes? Not that my theories are much of an explanation, I know — I’m really more interested in the symptom (if there even really is one) than my attempt at a diagnosis. If this is already well-understood, by all means tell me, too. 🙂
My, almost certainly incorrect non-expert, interpretation of Dave Garvie’s remarks was that where we see a large earthquake and an instant drop at around the same time, that these are not direct cause and effect, but that both represent the after effects of a much deeper event reaching the top end of the Volcano.
The big hole in my interpretation is, of course, why don’t we notice the initial event? The only answer that I can think off is that we do see it as a deep but small earthquake but don’t see the unexpected consequences of that small filtering up the system until it hits surface or close to the surface, and the combine into what looks like a major event.
I’ve probably been over thinking things in a very unscientific way. I’d love to know why I am wrong.
Hi wial!
Exactly my question. many thx for posting it. 🙂
Twitter messages are always very short, shorter as an sms. So it’s extremely difficult to explain something.
As far as I understood him, the 1-m-drop deep below where the quake happens, does not show up on the surface in complete immediately. Means we see a drop of maybe 20cm when the EQ occurs. The 80 cm that are left are taking more time, the ice needs to settle. But the 1m-drop of the caldera floor is in every case transfered to the surface – in two different speeds.
The 20cm in this example does not appear with every quake. It only will with large drops. Smaller quakes with smaller drops are smoothed by the ice.
So we see a mix here, and it’s impossible to figure out, which smooth subsidence belongs to which quake. They are overlapping.
IMHO
Perhaps we will have new pictures/videos on Saturday/Sunday from Holuhraun:
https://www.facebook.com/icelandreviewonline/posts/826167267427452
(No, I don’t think she is flying over the caldera …)
There is talk of the lava flow being as big as 1.2km³ on the Volcano Cafe website which is considerably bigger than Hekla in 1947 which I believe was 0.8km³.
If it is on VC it must be true!One of their to p commentators said the fissure was emitting 1000 kg of SO2 per m3 of magma,a bit strange when 80%+ of the gases in the eruption are H2O and a m3 of magma is about 3000 kg! lol
I think the volume now is most likely 1.1 km3. At the very least it is 0.8 km3. My calculation go like this:
54 km2 x average 20m thickness = 1.1 km3. If we use a very conservative average thickness of 15 meters, then it is just 0.81 km3. About 3 weeks ago, edge measured 8m, most of the flow measured 20m, and in parts the thickness was more than 30m. The vent measures itself more than 100 meters. Some days ago, the edge was reported to be 12m. So I think an average of 20m is totally acceptable now.
Average rate of 300m3/s (a video from the Cambridge team even says a rate of 400m3/s, but most figures from local scientists vary between 230 to 350 m3/s): 300 x 60 x 60 x 24 x 40 = 1.03 km3 and in the first day the rate was 1000m3/s. So the total volume is actually 1.1 km3.
So, yes, Geyser Soze, Holuhraun has erupted around 1.1km3
Problem with this calculation is: To say it “is” such and such, we would have to know exactly a l l the parameters. Even the production rate was just an estimated one, and there is a difference between 250 m3/sec and 350 m3 / sec. And no, we can’t just take and use the average here.
We neither know the exact thickness, you just use an average calculated, Irpsit, from some rather insecure parameters here. To know the exact thickness, there would have to be complicated field measurements at all sides of the lava field (i.e. also in the south, where is not has been done for some time as far as I remember) and also comparisons of satellite pictures and airplane pictures so as to know and take into account eg. all the hollows and valleys in the region which the lava has been smoothing out etc. etc.
So, it would of course be ok, to say “it could be” such and such, but there is no real provable figure here.
Yes, I agree.
1km3 is just an estimate. The IMO gave a 0.7km3 estimate some time ago.
We know of one value without uncertainty: 54km2 of area. For that, there is no doubt.
The average thickness is where estimates are uncertain. I say at the very least 5 meters, at the very most, 30 meters, so this gives a total volume between 0.27 to 1.62km3.
An average 10 meters is a low estimate, and an average 20 meters is what could be a high estimate. So most likely the eruption is between there, between 0.54 and 1.08 km3. It’s quite hard to determine a high estimate.
We know that this eruption has a volume somewhere in that range. Most likely anywhere between 0.5 and 1.1 km3.
Analysing previous topography against detailed current satellite, would give the thickness for each point of the lava field. But I guess no one analysed that yet.
what makes you think “it is not looking good” jonfr? small inflation of the GPS (von/dyn) does not tell you much, and the small earthquakes in the dyke is just decompressive responses to the big earthquakes at the caldera.
Its doing exactly what it has been doing for a while and there is no big change right now, i expect the caldera to drop 100’s of meeters before we might even begin to see signs of caldera plug getting unstable.
Some great satellite shots of the lava flow from LMU in München via Rei on Daily KOS and a little bit about the SO2 pollution.
http://www.dailykos.com/story/2014/10/09/1335585/-B-r-arbunga-And-Thus-The-Sky-Is-Blue
LMU links. The Ludwig Maximilian University in Munich is working on a project re. Icelandic volcanoes. They use remote sensing to detect signs of subglacial eruptions in the country.
http://www.isviews.geo.uni-muenchen.de/project/index.html
And here is a new satellite picture of Holuhraun (from Sept. 6):
http://www.isviews.geo.uni-muenchen.de/news/bardarbunga/rapideye_holuhraun/index.html
Here are some more pictures re. Icelandic volcanoes and glaciers (esp. Holuhraun / Bárdarbunga and Mýrdalsjökull /Katla):
http://www.isviews.geo.uni-muenchen.de/photos/index.html
Good stuff about SO2 in that article, e.g. “It was once believed that ‘volcanic winter’ was caused by particulate matter, such as fine ash. It is now known that particulate matter takes a distant second place to SO2.”
I found this site and wanted to share with all. It contains bardarbunga data all on one page such as charts, graphs, earthquake data, so2 map, cartoons etc. The page refreshes every 60 seconds or if you chose you can select the no refresh option near the top of the page. I do not know how to copy links, sorry you have to type it in yourself;
http://weerstationlangerak.nl/bardarbunga/
I´ve been looking at this illustration at the top made by “GLP member Gavin” showing no less than three magma chambers/reservoirs under BB. Do you have any thoughts about this Jón? Is this one of the “crazy” theories or are people seriously thinking this might be the case?
It’s this one:
http://weerstationlangerak.nl/bardarbunga/images/barda-caldera-gavin-u3139-fr.png
Original Chart is by: Haskoli Islands.
Modified for illustrational purposes (by this Gavin?).
VC goes one better ,4 pancake magma chambers,topped by a 10km thick “cork”,now how a caldera lid that thick that is only 10km wide could deform centrally is anyone’s guess?
I wonder, does this idea come from Magnus Tumi or does it come from Gavin?
Is it just me, or is the subsidence speeding up a little. In the beginning it was about 0.5 m a day, then slowed down to about 0.4 m. Now it seems to be around 0.5 again.
There has been heavy snow, so the GPS mat be affected by that.
Really? Because the webcam only shows a thin layer of snow, the rocks are still sticking out. Besides, how could that read as -more- subsidence? I´m talking about the average. Not the usual glitches on the graph.
Acc. to my map (Ísland Vegaatlas, 2006), Vaðalda, where the webcams are placed has a height of 941 m, Bárðarbunga has (had anyway) a height of 2009 m and Haraldur Sigurðsson mentioned – as far as I remember – the caldera rim being about 160 m higher than the (anyway former) center of the caldera, so there is a considerable height difference (around 900 m) which would also explain a harsher climate, more snow etc. , esp. as this is all in the middle of the country, the highlands, where temperatures in winter time might drop under -40°C (in Reykjavík, people think it being very cold, when there are temperatures around -10°C).
This to explain the very well possible icing on the GPS within the caldera of Bárðarbunga.
Wikipedia does not mention icing, but humidity as a reason for GPS errors, http://en.wikipedia.org/wiki/Error_analysis_for_the_Global_Positioning_System (Atmospheric effects) ,
also btw. the Aurora Borealis aka Northern Lights (see above, Natural sources of interference) – and we have a sunspot maximum now ( http://solarscience.msfc.nasa.gov/predict.shtml .
i guess i do know how to add links 🙂
That’s a brilliant link mrsdan! Thank you
I agree, a brilliant link. Thank you
The latest drop by about 40 cm seems to verify.
oops, rather 30 cm … lol
Large EQ
2014-10-10
11:26:16 UTC M4.7 ICELAND
19min ago Depth:2 Km
260 km E of Reykjavík, Iceland / pop: 113,906 / local time: 11:26:16.9 2014-10-10
Definite swarm ongoing in caldera
IMO gives M4.8, depth also 4.8 Km, 4 Km NNE of BB.
Does anyone know which direction this cam is looking from – is bardarbunga behind the mountains? http://www.midhus.is/
Yes, I think so. I remember the guy saying he changed the direction of the camera towards BB so it must be behind the mountains.
The webcam is really far away from Bardarbunga. Like more than 150km away. Never understood why everyone follows this webcam. It is located west of Eyjafjallajokull looking northeast I think.
Better to use milla webcams or the kverfjoll webcams. Those are the only ones pointing to the eruption.
thanks both!
The webcam is pointed north east. And yes it is about 150km away from Bárðaðrbunga. If there will be an eruption in the glacier then there is a possibility to see the top of the ash column. In the eruption of Grimsvötn 2011 we did have a good view from here.
Thanks – I enjoy looking, especially at dusk, Iceland is a beautiful place. I have been to the north, west and east of the island but never the south
Only through comparison of the US military GPS satellite data of the area before eruption to present could you get a figure of magma output with the lowest margin of error.
But Irpsit is conservative with his calculations regarding 15 m and so his final figure is a fair one without best data available.
Being conservative does not give the best estimate, neither the best feeling to the result. To get the best estimate we should do the calculations using two separate sets of input values – lower (conservative?) values but also values on the high end. Then we get an error bar, the correct result will be somewhere in the middle. Usually the result is represented by the mean of the results +- some value that accounts for the error.
Pictures (September 2014) of the eruption at Holuhraun / Bardarbunga:
http://www.lukas-gawenda.de/bildergalerie/
I think the test is to stand back and say to yourself,does this really look that large?Now really?,remember that some eruptions have to form an island from under the sea,this is just spreading out over a large plain.In fact if it was as voluminous as some say it would have possibly grown vertically more than it has.My guess possibly around 0.5km3
They say Holuhraun has already produced more than Surtsey, which took years to form. This has only been going on a little over a month now.
Yes true,but bigger than Mt St Helens,which blew the whole side of a mountain out?Just seems some scientists got a little too excited with the volume?
Mila_2 just cleared up and it looks like a second vent has opened up.
Are you on about the far right of the cam?
If so, is it a vent or lava flowing in a new direction?
Lava is flowing in a new direction but there seems to be some new activity at the corners of the old vent.
http://www.spiegel.de/wissenschaft/natur/vulkan-bardarbunga-in-island-eruption-koennte-klima-abkuehlen-a-995663.html
German newspaper article on possible climate effects of Holuhraun’s SO2. Since it’s not reaching the stratosphere, it has much less impact long term than comparable amounts from a big explosive eruption. Still, the volume is reaching the point this is starting to be a question, apparently.
Tropospheric injection has a different impact. It can enhance cloud formation in the troposphere. There are very few clouds (relatively speaking) in the stratosphere because it is non-convective (temperature increases with altitude rather than decreases as in the troposphere) so SO2 tends to cause a general reduction in transparency at visible wavelengths but in the troposphere, it can contribute to increased cloud formation by the creation of additional nuclei for the cloud droplets to form around.
This article explains the role of sulfuric acid in cloud formation:
http://wattsupwiththat.com/2014/10/09/superglue-for-the-atmosphere/
And this article gives an example of how SO2 can be converted into atmospheric sulfuric acid:
http://www.atmos-chem-phys.net/13/3865/2013/acp-13-3865-2013.html
Sorry, I appreciate the help, but isn’t any info from WUWT what they call in the law “fruit of the poisoned tree”? I’m sure they strive for legitimacy, but the basic belief system there is fundamentally at odds with science, so they’re bound to misstate facts at all kinds of levels. I’d rather avoid the confusion.
No.
This particular information comes from Goethe University Frankfurt, Germany. WUWT is one of the better science blogs out there. If you want to talk about “fruit if the poisoned tree”, I would draw your attention to the many links here people have posted from daily kos which is probably of one of THE most slanted agenda sites on the entire planet. I am not too worried about which site sends the bits, I am more concerned with the source of the information. This is a report on research done at a world class university, it isn’t an opinion piece.
I am interested in data and less interested in ideology.
And had you actually looked at the link rather than making a knee-jerk assumption, you would have noticed that the article I linked is simply an English translation from the German press release issued by the university. Your biases are showing.
I’m sorry I said anything. I didn’t expect my mention of the volcano’s influence on short term climate to bring all this stuff up.
Please let’s drop it before we piss Jón off again.
If people want to check out the science data on eruptions and climate they need to check articles like this one. With the amount of SO2 the eruption in Holuhraun is giving out it is a valid question. I’m just not into climate, since that is not my area of knowledge. I know what type of weather is outside when I look out the window and how to read the maps when the weather news are on the television. But nothing more than that.
http://www.nature.com/nature/journal/v393/n6684/abs/393450a0.html
I also almost never get pissed off today on behaviour on the internet. That is a waste of time and energy.
I had much fun with this website, you gave us the link to, Jón:
http://www.flamewarriorsguide.com/warriorshtm/evilclown.htm
😉 🙂
“Temperature reconstructions from tree-ring densities overestimate volcanic cooling†” http://onlinelibrary.wiley.com/doi/10.1002/2014GL061268/abstract
H/T to the tree of poisoned fruit
Bad air quality in South Iceland:Icelandic media:
http://www.visir.is/loftgaedi-oholl-a-sudurlandi/article/2014141019889
and Environment Agency:
http://www.ust.is/default.aspx?pageid=14da32aa-8362-4378-a165-d3a2a6d6f1c6&station=thjorsardalurleirubakki
Some pictures from Reykjavík today.
http://www.visir.is/skofu-bilana-undir-raudri-sol/article/2014141019980
Inge, I was outside 1 hour ago (I live north of Selfoss) and smelled again of chroline (probably HCl or simply Cl ions) and car-like smell (probably SO2). So, I was thinking the air pollution must be really high. This confirms it. 1500-2000 ug/m3 is quite a high level of SO2!
It also makes a subtle, small, pressure feeling on my chest, after breathing it for a while. Not overall bad. Had worse breathing chemicals on a lab.
Only time I felt HCl (or Cl) smell that was one Saturday that the haze was thick over Thingvellir, and one day I was in Sprengisandur.
Irpsit,shabby treatment you received on VC and totally unwarranted.Jon is to be congratulated for the civility he brings to his own blog.
The SO2 levels actually peaked at 2400 ug/m3.
Visibility is poor towards the east, but clearer towards Reykjavik. Smell of Cl and SO2. Next few days remains same wind, same situation. Turned the fans with towels soaked in baking soda.
Regarding that offtopic matter, Geyser, I just stood against one of their rules which was removal of opinions regarding moderation. I did that respectfully because I noticed recurrent harsh behavior. Well, I don’t want waste time with it anymore.
I haven’t seen any shabby treatment, Geyser.
A towel and fan with baking soda (natural humidifier) can help but, should this event continue, an evaporative humidifier might be handy, if you can get one.
http://en.wikipedia.org/wiki/Humidifier
I have also heard that washing soda is cheaper than baking soda. Best of luck
Tyler Mannison, they edited most of it out of the thread,it was nasty response to Jaybee giving a well formed alternate view to Irpsit’s volume calculation.Really silly stuff and worse than I witnessed during my brief stint there.
The chlorine smell is interesting,does anyone have any idea why is this,reaction with seawater ?
You mentionend that you lived in Grímsnes, Irpsit? This is just about 20-25 km from the sea, isn’t it?
This article also mentions Hydrogene chloride as one of the gases emitted by volcanic eruptions.
http://www.atmos-chem-phys.net/8/3881/2008/acp-8-3881-2008.pdf
But this could also be traces in the reactivated ash from Eyjafjallajökull’s 2010 eruption, which with an eastern wind would reach Grímsnes (just about 60 km away from the volcano): http://www.sciencedaily.com/releases/2011/05/110527080327.htm
So this could still be a mixture of Bárðarbunga and Eyjafjallajökull eruption products. Hope this is not the same in Hella as I have friends there… 🙂
🙁 I intented something like that …
I have read all your comments since 2010. At the moment VC have become so wrapped up in themselves, they have forgotten.. us. It will not stay this way, well hopefully, they just have to realise that, intelligance has no boundary.
I could go all goofy and say you have taught me a lot about Iceland. Instead I will say that a lot of people would miss a lot of knowledge without you.
(and yes I know I am going to get in trouble)!!
http://www.annalsofgeophysics.eu/index.php/annals/article/view/3223
Way way waaaay off topic (only to be mentioned once for those nordic types who might not know and care to learn further. Too outlandish even for VC) …
http://www.cbc.ca/news/canada/british-columbia/amaruk-wilderness-questions-raised-about-company-at-centre-of-anti-christian-attack-1.2794452
I too received shabby treatment from VC just others who have left VC including Luisport and and I also congratulate Jon that he does not judge people or ridicules their questions but treats everyone as a human being.
Thank you!
Maybe if you people followed the rules, you wouldn’t have been banned. I love the Admins at VC.
I wasn’t banned. I refused to post ever in VC. Carl hask me to reconsider… But it doesn’t matter now.
Tyler perhaps you should not make assumptions.
I cant see a think at Bardy so I looked at the other cams.
LQQK at this – HEKLA!
Full moon hangin in the night sky!
http://i61.tinypic.com/68tt1e.jpg
Very nice!
By the way: What happened at this webcam? (nothing volcanic, OT)
http://www.livefromiceland.is/webcams/etgc2014/
According to this the scientists did fly over the eruption area today, but no pictures and apparently nothing new to report.
http://www.ruv.is/frett/mikil-blamoda-og-gas
They used the special aircraft TF-SIF today. http://www.visir.is/engir-skjalftar-yfir-fimm-ad-staerd/article/2014141019868
I think they measured the gases. Perhaps some more data during the next days will be published (just my presumption).
In the news article is also mentioned that there was no 5+ earthquake today. At the moment the biggest one was 4.7 acc. to IMO. http://www.vedur.is/#syn=skjalftar
thank you for the great site with a lot of good info on the eruption.
I have difficulty with the interpretation that the subsidence measured is the subsidence of the Caldera floor because you measure on top of 700 m of ice above the caldera floor.
I agree that it is the most plausible scenario but there are other options: but as I’m no expert on volcano’s all comments are welcome:
– could it be due to ice melting. The density of ice is 0.9167 g/cm3 at 0 °C, whereas water has a density of 0.9998 g/cm³ at the same temperature. Thus when the ice at the bottom melts an approximate 9 % of density increase is achieved. 12 meter of subsidence is thus equivalent to a melt of 132 meter of ice. This means a (big) lake at the bottom of the caldera. Can this happen (ring like structure at the bottom) or is there drainage.
– or it could be less melt but the water being evacuated to an underground lake because there has been no real change in river flow and conductivity that is not explainable with rain/precipitation.
Or can these scenario’s be excluded base on seismic data?
Not always necessarily all lake at the heart of craters though. Mount Rainier Caves
Oops… bad link. Mount Rainier Caves
Friday
10.10.2014 21:04:56 64.667 -17.440 1.1 km 4.5 99.0 5.1 km NE of Bárðarbunga
All the gas and lava being emitted makes the Holuhraun eruption a minor example of a Laki 1783 event. Hang in there!
Yeah, let´s hope it stays minor.
China today …
http://www.theguardian.com/environment/2014/oct/10/china-pollution-levels-hit-20-times-safe-levels
Industrial air pollution can be kinda bad.
New article about Bárðarbunga volcano is up. 🙂
Dear hard working Jon,
WHEN you put a note up about “New article . . . ”
it would be a great “user-friendly” thoughtful kindness to fossilized old farts like me IF you would be willing to put a direct link to said new article. Thanks in advance for considering this request.
You only need to click on “Iceland Geology” at the top of the page. It will always take you to the newest content.
OK. THX.