
This information is going to get outdated quickly if anything happens in Bárðarbunga volcano.
Current status in Bárðarbunga volcano at 23:03 UTC
- The eruption in Holuhraun continues at the same rate as before. There are no signs of it slowing down. I don’t know if new craters have opened up, it doesn’t look like it at the moment.
- Bad weather has prevented visibility check from the ground. There currently is storm in the area with limited visibility at the moment. Please check the wind map for more details.
- Largest earthquakes so far today where two magnitude 4,8 earthquakes that took place at 00:36 UTC and 13:27 UTC. Second largest earthquake took place at 06:39 UTC and had the magnitude of 4,6. Other earthquakes are smaller.
- It seems that earthquake activity is increasing in Bárðarbunga volcano. I don’t think that is a good sign. So far there are no signs of an eruption under the glacier, at least not a large one at the moment.
- Magma continues to flow into the dyke at the same rate as before. It also appears that the pressure inside the dyke is increasing since the eruption in Holuhraun is not keeping up with the material that is flowing into it.
- Due to bad weather I don’t have any more information on the eruption in Holuhraun.
- Bad weather is expected tomorrow in north Iceland and in the higher parts of Iceland at the same time. Snow is expected to fall in mountains and higher areas. This is going to mean poor or no visibility on Míla web cameras during this bad weather.
Information from GPS data
GPS data shows that the dyke that feeds the eruption in Holuhraun eruption is being well fed. There are no signs of any contraction taking place and it is clearly not cooling down. Earthquakes happen in the dyke when it expands since the eruption is not big enough. I don’t know why eruption has not yet broken up in a new place yet. As the times goes on the rock around the dyke gets soft from the heat, it turns into rubber type of mush that no longer breaks. This also applies to the crust above it. The depth down to the dyke is no more than 2 km, but it is expected that it is around 1 km or shallower in some areas.
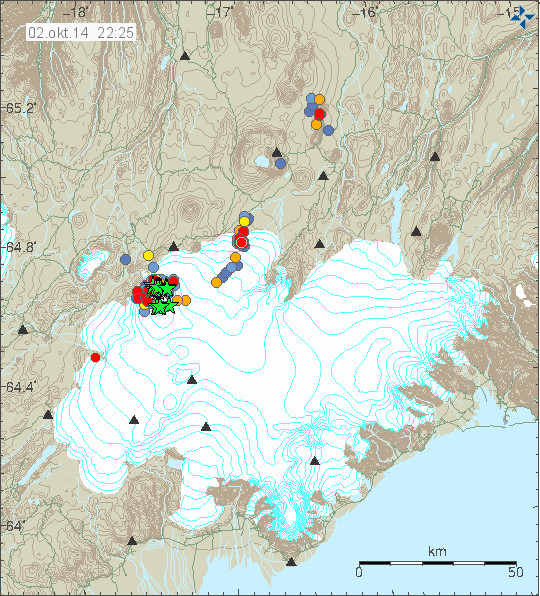
The earthquake activity in Bárðarbunga volcano today and for the last 48 hours. This is just the earthquakes that have been recorded today trough the bad weather that has been taking place. So I am expecting more earthquake to have taken place than are showing up here. Copyright of this image belongs to Icelandic Met Office.
When the earthquake data is connected to GPS data it tells the story of an dyke that is being well fed and is trying to expand into nearby crust. Creating minor earthquake activity in the process. It is erupting so it can only expand by the volume that the eruption is not erupting. I don’t know how much that is, the dyke it self is around 3 – 4 meters wide and around 10 – 15 km deep (best estimate).
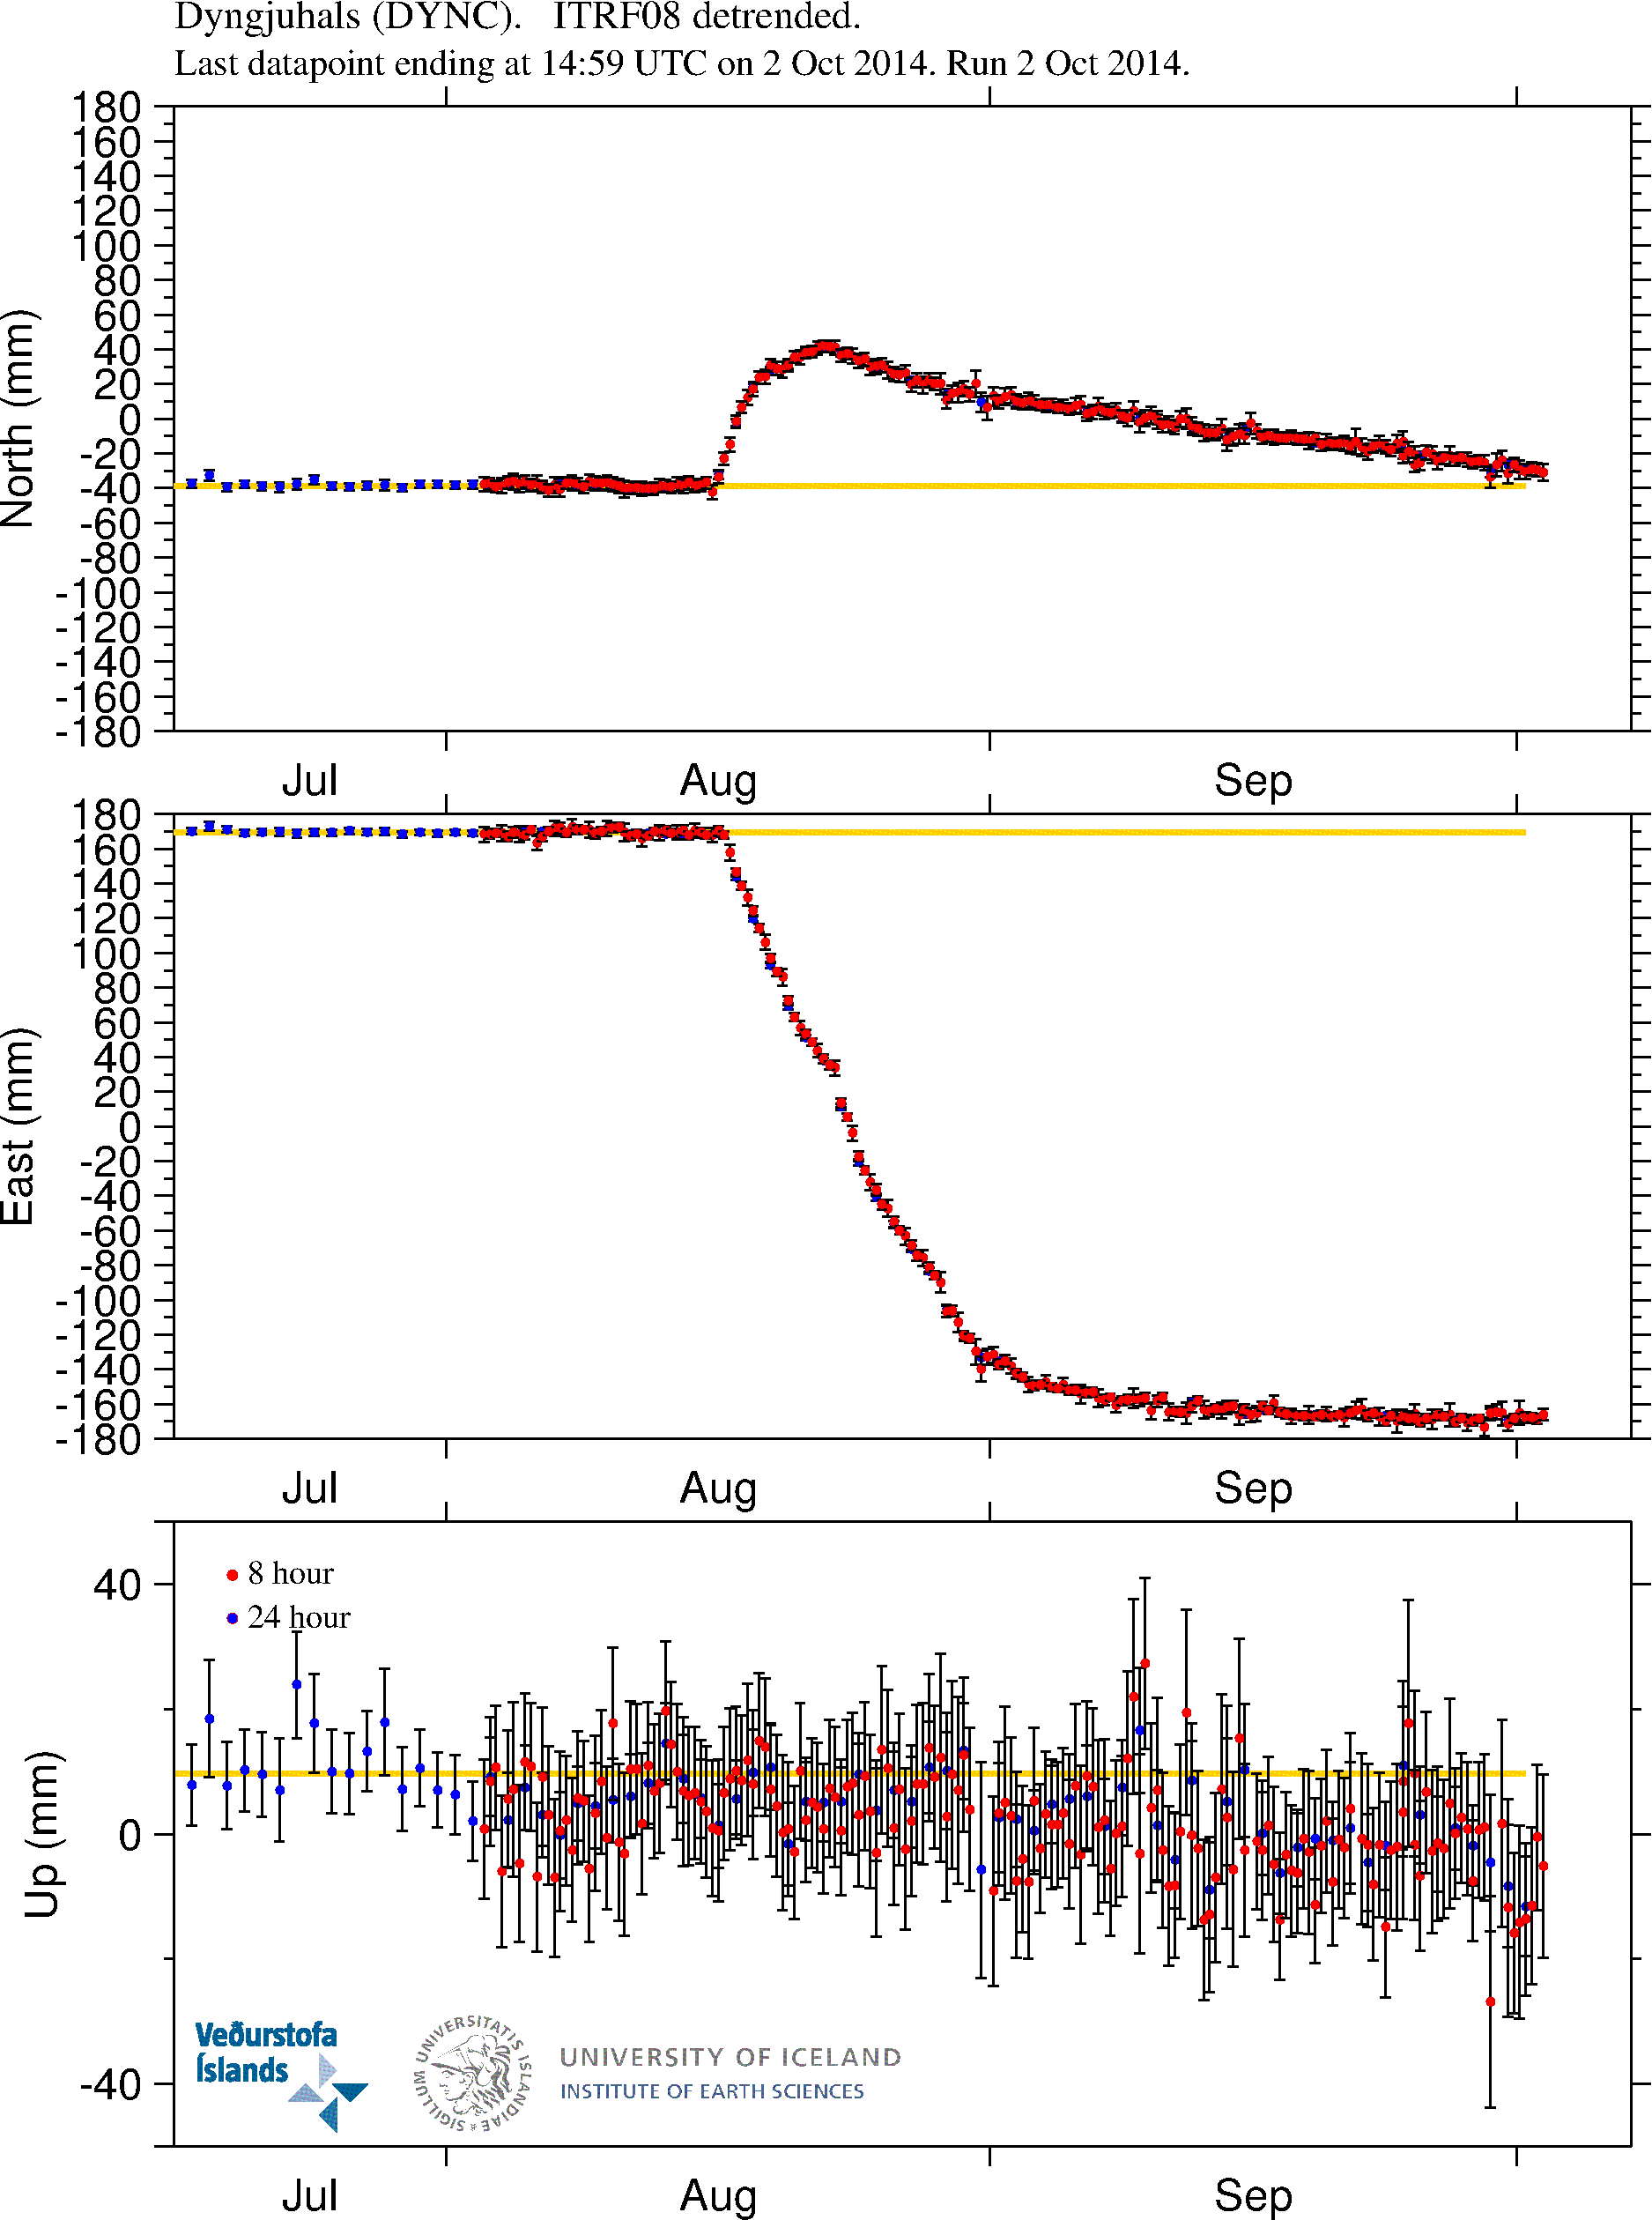
The dyke size and feeding appears clearly here. I don’t know why it is moving west now, rather than east. This might suggest that something else is going on that does not appear on the surface yet (it might never appear on the surface). Copyright of this image belongs to University of Iceland.
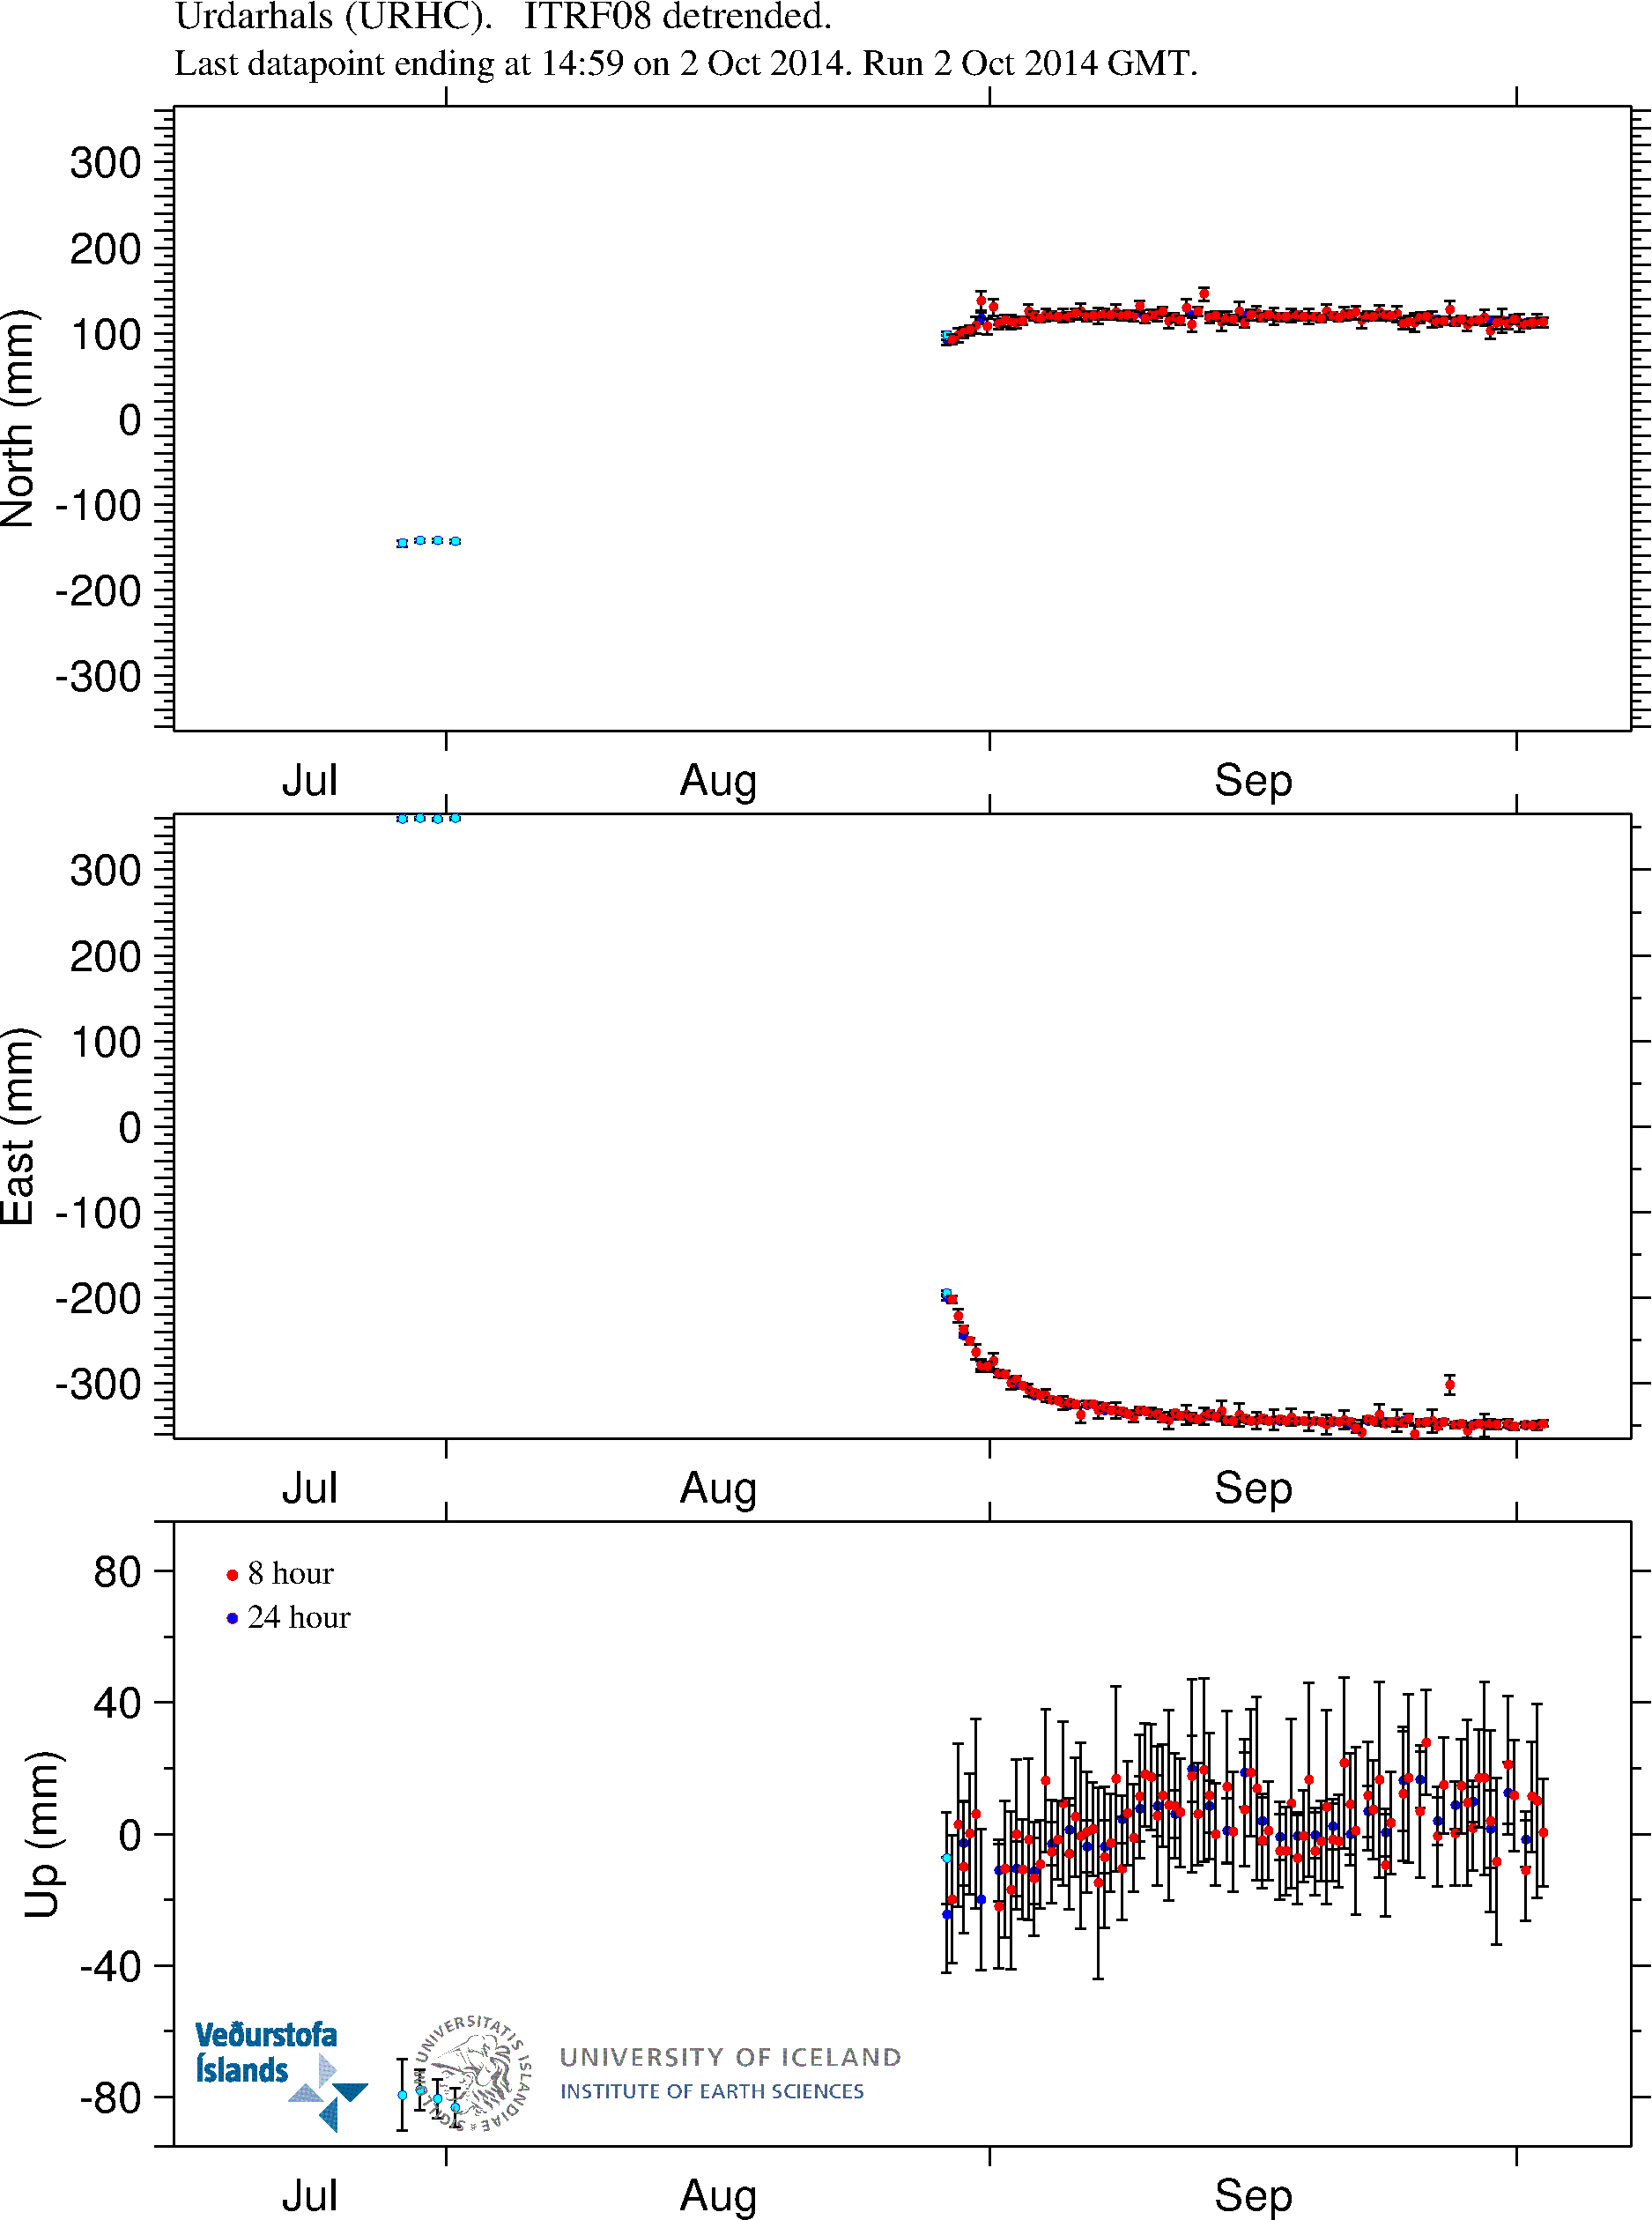
It is almost the same story on this GPS station. With the exception it is not moving to the west. It is stable where it is. This GPS station is almost on top of the dyke. So any change is going to appear quickly on it. Copyright of this image belongs to University of Iceland.
More GPS stations and information can be found here on University of Iceland website.
Break from Friday
I am going to go on a little break during this weekend from Friday. This means the following.
- Comments are going to stay a little longer in moderation queue if you are commenting for the first time, or posting many links. If your comment vanishes it means the spam filter ate it, so it is going to take me a little time to recover it. So just wait a little for it.
- If anything happens I might not be able to update this website with newest information right away. I will try to do soon as possible if I can.
- Update for the Friday (03-October-2014) might be short and come in late (or not at all). When I don’t know yet.
This has been a busy one and half month for me. I’ve been watching Bárðarbunga volcano for almost all hours of the day regardless where I am and what I am doing. After a while it starts to tire you. That is why Icelandic Met Office and University of Iceland have people on rotation during this eruption. I don’t have that option so I just have to take a short breaks and hope nothing big happens while I am resting my self for a short while.
I did learn during the Eyjafjallajökull eruption in 2010 that if I spend too much time in this I burn out and the recovery from that is long process. That is why I now have plan to prevent that during a long eruption, that covers eruptions that are longer than one month. Like is now the case in Bárðarbunga volcano.
I advice this for anyone how is going to watch this eruption for a long period of time (since it is going to last a long period of time). Spending too much time on an eruption is not good. Even a one day break is a good thing for anyone watching this eruption.
In the case there is no new article tomorrow. I wish everyone a good weekend.
Article updated at 23:42 UTC
Article updated at 23:43 UTC
Thanks Jón!
Good advice re taking a break. For a while there I had to miss a day or two at a time and it is indeed good to take breathers. Of course, I believe there’s a Murphy’s Law for volcanologists that does apply …
Great update Jon! Have fun on your trip and relax!
Jón, have a fine weekend! As you live in a democratic country, past would not be altered so in case anything happens, still there would be enough time for you to cover it later. 🙂
Jon’s webicorders showing nice size quake in the 01:00 hour. USGS has M4.8, so IMO should have it at M5.0-5.3.
Jon,
All your hard work has been valuable to all of us, and we thank you. Rest well. I’ve been fighting a cold the last few days, but only a after running myself into the ground. Please take care of yourself and don’t be like me. Updates can wait for health. 🙂
Wish you a nice weekend – and thank you for everything 🙂 Also for taking a break! Hope, you prepared already a warm blanket – a cup of tea (or whatever) – and the boots for walking outside.
+ 1 🙂
Really an interesting update also, thank you, Jón.
Thanks for the update.
Eruption looks bigger after you have not been checking for few nights. And it is.
It is in fact slowly slowly increasing since the beginning.. the Dike might turn into a crater itself as it is slowly slowly slowly growing both the lava “lake” and the “caldera”.
Time scale is different in this one.
It’s necessary to enjoy also with Humans and not only with stones.
Human smiles in a second, Stones may take years.
Thanks for the humor. Have a great time you all!
Enjoy your rest and do something really different. All the best. Always interesting to read your blog.
No 5+ quakes since the 29th per the lower graph on http://hraun.vedur.is/ja/Bardarb/BARC/ . That’s a huge change.
Not really. I believe that there is a dome building event going on at the north edge of the caldera and the path is becoming clearer. The drop you see on GPS is due to melting ice, not due to “caldera collapse”. I believe there is an eruption ongoing at the deepest part of the caldera. We just don’t see any surface evidence of it yet aside from the drop in the surface altitude of the surface of the ice in the caldera.
The penatrating radar scans IMO have carried out don’t agree with you – they show a caldera drop.
There has been no such penetrating radar imaging done within the caldera. There has been some done on the glacier outside the caldera but so far I have seen no radar imaging at the caldera that has penetrated more than a few hundred meters. The bottom of the caldera is over 800 meters deep. There is no radar imaging there.
And I believe this is not the first time you have repeated that inaccurate information. Please provide any links you might have to what you believe might be radar imaging of the caldera.
And a quick search on “deep penetration radar” manages to net a chart that says it can image through 1000m of air/ice. Now, this doesn’t say anyone has done one or if the results have been released, but it does mean the technical capability is there.
I’m not sure I follow your reasoning:
– The GPS drop is due to melting ice.
– There is no caldera collapse/subsidence but rather an eruption going on deep in the caldera.
– Evidence for that is the drop in the surface ice.
Are you saying that the heat from the eruption at, say, 5 km depth, is causing the melting > drop in the ice on the surface?
If so, there’s a pretty subtantial amount of water to be accounted for, isn’t there? Where has it gone?
And in any case, what is an eruption within a caldera? How does that differ from magma movements within a caldera? Isn’t it only when magma movements reach the surface that we talk about an eruption?
In ’96 the Gjálp eruption in Grímsvötn took less then two days to go trough 5-600 m thick ice.
If your hypothesis was correct, then one could expect to see subsistence greatest at the north end of the caldera,
If the belief in the caldera floor subsiding was correct, then one could expect to see subsitance greatest in the middle of the caldera. (Typical of caldera collapse. No drop is ever uniform. Material piles up on the edges where there is the greatest resistance. Some of it dirt or ice piling up, some of it crust that’s breaking and or folding from the stress)
Looking at the easiest map for me to find.
http://www.ruv.is/frett/continuing-subsidence-in-bardarbunga
The subsistence doesn’t appear to be following your ice melting at the north end hypothesis. Quite a typical caldera collapse pattern actually.
I am a little annoyed that what I was afraid would happen is happening. That is, persons who are trying to interpret the recent slow-down of the fissure eruptions, together with the weakening of the earthquakes within the caldera and apparent slight flattening of its top, interpret it to mean that the eruption at Bardarbunga is slowing down and headed for a halt. May I remind you that as I learned in a previous Frimann report blog, the most realistic interpretation of this very recent phenomenon is that the previous methods the volcano employed to release increasing magma pressure from below, are reaching a tipping point of having gone as far as they can. And therefore the pressure within the volcano caldera is building up – increasing not diminishing This is where some science here would be a big help – electronic measurement of conditions within the caldera. Even photos of what is showing on top of the caldera day-by=day so comparisons could be made and surface developments closely monitored, would be very valuable, as Crosspatch and others have said!
Coming home from two days break (work, learning and party with nice people) without connection to the web, I can say it is good to see other things than volcanos. Have a good time Jon and take care of you.
Beeing back is also good, the information is stored 🙂
The view of the eruption on both webcams is incredible today.
Have a good rest Jon. Thank you for your great work.
I hope you have a really great break, you certainly deserve one. It does seem that when you plan a little time for yourself something more happens. However, unless something is absolutely major I would encourage you to make the most of your break, and cover it retrospectively. You have got to have time for yourself, to nourish body, mind and soul.
Jon you don’t need to write here every day, don’t burn out, but explain those people
what those pictures mean, they will like when they understand , it’s your job, you are good in that, and
you must say that you don’t understand what is going, because no one knows, but you say it
rest, good weekend
imri
“Are you saying that the heat from the eruption at, say, 5 km depth, is causing the melting ”
Yes.
“If so, there’s a pretty subtantial amount of water to be accounted for, isn’t there? Where has it gone?”
The caldera itself is like a bowl. The water is collecting inside the caldera and will only “leak” out after the water level would rise some 700 meters to the edge of the caldera rim. People don’t seem to understand the configuration. The glacier rises some 100 to 150 meters over the rim of the caldera.
“Isn’t it only when magma movements reach the surface that we talk about an eruption?”
The “surface” of the crust at the north side of the caldera is still under over 800 meters of ice and water. The magma could well reach the surface of the crust but have no visible impact at the surface other than melting of ice.
Thanks. To your last reply: if the magma is reaching the surface of the crust, then by your model it’s encountering water and ice. But that means explosive activity, which we aren’t seeing. And as Jonni says, in 1996, it took only two days for 500m of ice to be melted. So I’m still not persuaded.
This obviously depends on quantity and flowrates of the magma.
Anything is possible and we know very little.
http://en.vedur.is/earthquakes-and-volcanism/articles/nr/2947
From the 6th September:
“Conclusions of the Scientific Advisory Board of the Icelandic Civil Protection:
In the surveillance flight yesterday the ice-surface at Bárðarbunga was measured with the radar system of Isavia’s aircraft. The measurements show large changes on the ice-surface. Up to 15 m subsidence has occurred in the centre of the caldera, which corresponds to a volume change of 0.25 km³. The shape of the subsidence area is in accordance with the elevation of the caldera floor having lowered by that amount.
Subsidence of this order has not been observed in Iceland since measurements of crustal movements started around the middle of last century.
No signs of eruption or increased geothermal activity in the Bárðarbunga caldera are observed.
The volume of the subsidence in Bárðarbunga is considerable portion of the total volume of the magma dyke.
The most probable explanation is that this subsidence is related to the recent high seismic activity and subsurface magma flow to the northeast.”
Carl at VC said the aircraft was equipped with ground penetrating radar, but I haven’t seen this confirmed officially anywhere.
This is the preliminary result for the first flight on the 5th of September, when the subsidence was first discovered via radar. They used an accurate 2011 ground radar measurement for comparison. It´s in Icelandic only. This is on their own site so I´d gather it´s pretty official.
http://jardvis.hi.is/bardarbunga_sig_jokulyfirbords_bradabirgdakort
On the 8th they repeated the measurement, to see if there was a change and here is the result.
http://avd.is/is/?p=409
A third flight-over is scheduled this week. I´ll let you know as soon as the results come in. I am not sure exactly when, as the radar equipped plane was in for service earlier this week, and the weather has been pretty unstable.
That appears to be radar of the surface of the ice, which is pretty easy to do. It is also consistent with some radar interferometry graphics I saw recently. This radar image, for example, does not even image the caldera rim.
http://earthice.hi.is/sites/jardvis.hi.is/files/myndir/Bardarbunga/sif_bardarbunga_23august2014_e.png
http://jardvis.hi.is/sig_bardarbungu_maelingaflug_13_september_2014
My understanding is that these are flyover results with penetrating radar. None done recently due to budget/weather.
How do you account for the earthquake focal mechanisms also indicating subsidence, in your hypothesis?
Come on Crosspatch, you trot out this thery every few days. Jon posted the links last time you posted this. Links to the DPR scan flown from north to south directly through the caldera, ( link posted earlier today) link to GPS stations all showing the steady drop in the caldera, and links to the LADAR scans showing the same drop in the ice. One of the scientist also remarked that the caldera floor and ice seem to be dropping in tandem with very little difference.
Have a great weekend Jon thanks for all the input, hope you don’t miss anything.
Does anyone know why the GPS charts on http://hraun.vedur.is/ja/Bardarb/BARC/
are showing different timings the top chart has not updated since yesterday, but the lower chart seems to have done, strange.
I don’t know what software they use to generate the charts, but probably only a software error.
The top chart (realtime / 30 / 180) hasn’t updated since yesterday . the bottom one is updating every 30 minutes .
fixed now
It’s friday. According to my Almanac friday is a good fishing day.
Slightly OT:
There has been installed the first groundwater monitoring station near Hekla yesterday (BGS Tweet, 16 hours ago).
The GPS graphics stopped updating the top chart at 10/2 13:55. Lower chart is still updating time, but the graph is the same. Lots of smaller than 5s EQ showing.
http://hraun.vedur.is/ja/Bardarb/BARC/
Does anyone think it significant that the long-term GPS data shows a gradual slowing of the rate of subsidence? It appears the rate is now less than 40cm per day, whereas the first 10-12 days shows 50cm per day. I have not seen any remarks about the change, but am curious as to what opinions there might be.
A food for thought. I came across a blog from 2011, speculations about which volcano in Iceland is most likely to be the next one to erupt. This emphasizes how practically impossible it is to predict volcanic activity in most cases.
Katla 30%
Hekla 27%
Grímsvötn 16%
Bárðarbunga 7%
Askja 6%
Reykjanesskagi 5%
Suðurhálendið 4%
Other 5%
http://emilhannes.blog.is/blog/emilhannes/entry/1198833/
PLEASE,just look up “Radioglaciology” on Wikipedia to find out about the capabilities of modern airborne ice-penetrating radar systems. By flying repeat transects over the caldera, IMO/University of Iceland will be able to detect and map the radar reflectors from the ice surface, the bedrock surface of the caldera, the interface between the ice and any meltwater that has accumulated at its base, and any internal reflectors within the ice. This technology has been around for more than 40 years!
Jon, please have a good break, we all appreciate your efforts!
you deserve a break jon – thanks for ALL your updates. i read them every chance i get. enjoy your trip
Yeah, back in 2010 or 2011 I was making predictions, but slightly different, something like this:
-These were the likely ones to erupt this decade:
Grimsvotn 33%, which happened, we expect it to erupt every few years
Hekla 25%, which is the other obvious one
Askja 12%, because of intrusions going there for a long time, and inflation going on
Bardarbunga 11%, same thing, and it’s hotspot center
Katla 10%, because of it restlessness at that time, but due to lack of inflation I didn’t believe it would erupt
-These ones could erupt sometime next two or three decades:
Kverfjoll 4%
Reykjanes volcano 2%
-These ones are much less likely, probably within a century or two
Langjokull 2%
Other (Esjufjoll, Hofsjokull, Tungnafellsjokull, Veidivotn, Torfajokull) 1%
– – – – –
Now I make my predictions different. See how they have changed. Due to increase in the hotspot region, I expect many more eruptions within next two decades. As many of these volcanoes have had intrusions and ready to erupt, it’s hard to predict which one goes next, but the next ones are all LIKELY to erupt next 10-15 years:
Grimsvotn 18%,
Askja-Herdubreid 12%
Hekla 10%
Kverfjoll 10%
These ones are not as likely, but I think they could be unexpected surprises:
Reykjanes volcano 10%
Hamarinn or somewhere else along Bardarbunga southwest 10%
Tungnafellsjokull (not necessarely in the caldera) 10%
Vatnsjoll or somewhere near Hekla 10%
Katla 5%
These ones are much less likely:
Langjokull (southeast of the ice cap) 3%
Esjufjoll 1%
Other (Oraefajokull, Hofsjokull, Torfajokull) 1%
I find it interesting that you give Katla only 5%. Because it´s been expected to erupt any minute now for more than 30 years.
Yeah that surprised me too especially given the coupling with Eyjafjallajökull historically and its recent Jökulhlaup.
Are these probabilities for eruption within the next 10 years?
On average there is an eruption less than every three years in Iceland, although the time between varies. This prediction is more about which one could be next. It could happen next year or in five years. Ten years is less likely given the history.
Thanks for prediction information.
What about prediction of glacial flood?
even a range for prob. of significant glacial flood, say within next month.
and again, say within next year.
10% to 30% within next month ? or what?
20% to 60% within next year? or what?
also I just notice this in regards to no earthquakes above 5.0 for some time:
Updated information
3 October 2014 19:00 – from geoscientist on duty
The largest earthquake at Bárðarbunga since 07 AM was size 5.0 at 12:42
Hi everyone, the predictions I made are of the probability of what I think will be the next volcano to erupt, not for how likely is that volcano to erupt.
Anyways, this is all just my pure speculation. No science here. Just my wild bets, my opinion, based in what I know about those volcanoes, their past and current state, their patterns and the current hotspot situation in Iceland.
I think Grimsvotn is 35% likely to erupt next 6-12 months, but 95% likely to erupt in next 6-7 years; actually quite likely to erupt by 2016 or 2017. Hekla is sort of a 50-60% change of erupting until of end of the decade at any given day. Katla, yes, I don’t think it’s that likely to erupt this decade, this is my opinion based on its lack of inflation. I give it a likelihood of 30% of eruption within next couple of years, but probably 50-60% within the next 15 years, and certainly 90% of eruption until mid century.
I think the region near Askja and Herdubreid is 50%, maybe 60%, likely to erupt until end of the decade. There are continuous swarms there, so I wouldn’t be surprised to see there our next Icelandic eruption.
Kverfjoll: I think there is some change that Kverfjoll might erupt within the next 15 years, due to the increased hotspot activity. I give it a 20-30% change. Also Reykjanes, which has had intense swarms in the past, and erupts every few decades, and shows recent increase geothermal activity. I think Reykjanes has some change of eruption within these decade or next. Let’s say anything like 15 to 30%.
Hamarinn or somewhere else along Bardarbunga southwest: less likely to erupt in soon, but I think an eruption 5-10 years down the road is somewhat likely, let’s say 30%. Only if rifting starts to occur towards that direction,something that it can. And perhaps a 60% change of eruption in next few decades. A Veidivotn-scale episode is probably less likely but still possible.
Tungnafellsjokull, hmmm a wild card. While it erupted maybe only once or twice since ice age, and outside of its caldera, I think it could do it again, after all this activity in Bardarbunga. Let’s say a 15% change of erupting next 15 years. Same thing for Vatnsjoll, or somewhere near Hekla, while not a typical expected spot for an eruption it has swarms ocasionally, and so I give it a small change of eruption in next few decades.
I give perhaps a 2-5% change of eruption that Langjokull, Esjufjoll, Oraefajokull, Hofsjokull, Torfajokull, erupt these next two decades. Possible but unlikely.
It seems to me ,that the North caldera rim is under compression and the South rim is under tension and this effect has been on going since caldera formation and maybe it has proceeded previous activity there?So is there cryptodome formation,s pushing NE creating deformation subsidence in its wake and crustal distortion and uplift in its direction of progression?
Definition of “cryptodome” (USGS):
http://volcanoes.usgs.gov/vsc/glossary/cryptodome.html
A famous cryptodome played an important role in the 1980 eruption of Mt. St Helens.
http://books.google.de/books?hl=de&lr=&id=9og-r71PymgC&oi=fnd&pg=PA401&dq=crypto+dome+Mt.+St+Helens&ots=-PTL8_dswo&sig=i0mu516zfALmXTUlt061fiT2k90#v=onepage&q=crypto%20dome%20Mt.%20St%20Helens&f=false
In Iceland, these last years, there has been discussion about a cryptodome situated at Goðabunga under Mýrdalsjökull:
http://www.sciencedirect.com/science/article/pii/S0377027305003963
This cryptodome (Icelandic: hraungull) is shown on the drawing by Páll Einarsson on this page (Univ. of Iceland/Eyjafjallajökull 2010):
http://jardvis.hi.is/kort_og_skyringamyndir
(scroll down)
Long time listener, first time caller.
So, caveats. I am definitely *not* a vulcanologist. Nor do I have any significant training in geology. My background is Mechanical Engineering.
When I look at http://hraun.vedur.is/ja/Bardarb/BARC/ , I see an exponential decay curve. When I read about the caldera and its connection to the fissure, I think accumulator under pressure connected to a relief valve.
Based on this, here’s my less-then-informed assessment/prediction.
The event is slowly dying down.
Time constant for the decay of the subsidence curve looks to be about 50 days.
Subsidence will level off about 15 to 16 meters below where it is today (for a total subsidence since the start of the chart of ~25m).
We’ll probably see something along the lines of a shut-off before then though. Say around the 20m mark. That would be about 2 1/2 months out from the start of the chart or the start of Dec.
We’ll also start to see a gradual reduction in outflow from the fissure.
Jon, in the pool, I’ll take:
* total caldera subsidence of 43m (20m add’l + 23m from before 14 Sep),
* total lava outflow of 1.5 km^3
* Round 1 ending on 1 Dec. without additional incident.
Of course, this is assuming the caldera roof doesn’t go all melty… and other contingencies. Your mileage may vary.
By the way, for those of you playing along with the home game, change in caldera volume is closer to conic than cylindrical, So for anyone doing their own calcs, it’s 1/3 pi r^2 h, instead of pi r^2 h.
Not going to hazard a guess on timing or scale of Round 2.
– JCPfl.
I see nothing else then a linear behaviour over the last 20 days. Almost perfectly linear.
*Almost* is the operative word.
Look a little more closely.
First week, subsidence was around 50cm/day.
Second week closer to 40cm/day.
Third week, closer to 35cm/day.
You can also match up a straightedge to the curve to see the decay.
I just did a little fairly simple curve fit, grabbing data points at Day 8 (20 Sept) and today. Model for an exponential decay curve is:
y = a * e^(-bt) + c
1/b gives you the time constant. In this case, about 50 days. I.e., in every 50 day period, the curve value will decrease to 1/e of its value at the start of the period.
Equally uneducated predictor here, just wanted to point out (amongst the million things that could be debated) that the magma analysis I’ve seen suggests that there is a deeper origin than the chamber below the caldera, potentially connected to a mantle source. That means an unkown filling variable in addition to your slow valve relief. Additionally, as you alluded to, caldera collapse would be a sudden event that would change this into more of a champagne bottle situation. Which I happen to be very familiar with, lol.
Still, nifty number navigating on your part….we shall see.
I know — perplexing isn’t it?
The magma analysis suggests a deeper source. But, if that’s the case, then I have to ask either:
* (in the case the deeper source of magma is also supplying Bard)
why isn’t the caldera subsidence slowing down more and trending toward caldera inflation, or
* (in the case the deeper source of magma is not supplying Bard.)
where’s the sub-caldera magma going?
I know that the subject-matter experts have been pointing out the GPS data and attributing to general inflation in the area. The August and September data, though, look very different. Movement rates look like they’ve slowed significantly. My uninformed opinion is that while the rift may be continuing to spread, it’s not spreading at the rate it was in August.
Okay, time to go back to lurking I think. This really isn’t my field – may be a good idea to return it to the experts.
Pflueger, smart observation.
Sinking of caldera is slowly decreasing.
Maths predicts that it will stall by December at 45-55 meters.
But the eruption will not necessarely stop. It might had mantle feeder. Or might not. But I might decrease in rate but keep on for a long time after, if mantle feeder.
If it stalls then it stops at 1km3 to 2 km3. If it continues, it might build a larger shield volcano, in the range of 5 km3.
I think that seeing significant behavior change in either the caldera or the dyke, without a significant change in the other, would be a strong indicator that the mantle is currently involved.
I’ve been looking for that, but haven’t seen it so far.
** ** ** ** **
With respect to the long-term, I’ll be surprised if this is a one-act play. Whatever kicked things off in early August will come around again.
To get a reasonable fit for an exponential time course with time constant x, you need to fit on a dataset of at least 3 times the time constant. Which means 150 days. that´s at least what I learned long time ago.
Excellent post. Just because you’re not a volcanologist, that doesn’t disqualify you. In fact your MechEng training is very valuable.
Itoo see a reducing rate of subsidence. Just look along the line showing the drop over the last month. It is plain to see.
So whilst I agree with your assessment, what none of us know is whether there will be anything that changes what is currently a steady state. This could change things significantly.
The GPS top chart si OK again
http://hraun.vedur.is/ja/Bardarb/BARC/
.. and again back to the past
Hey , noone menioned that there was a 5.0:
Friday
03.10.2014 12:42:52 64.671 -17.454 7.9 km 5.0 99.0 4.9 km NE of Bárðarbunga
and another drop…
The long term subsidence curve looks more even the last couple of days. Less big drops. Too bad the three day graph doesn´t seem to work anymore.
Its working now
It is!
Interesting. The last time I looked at the long GPS graph, the drop averaged 7.92 meters over 18 days or .44cm per day. I think I looked at that about less than a week ago. Today, over 18 days, it is 9.3 meters or .52cm per day. Thought I would mention that, because as I was looking at it, it looks like the last couple of days have flatened slightly, but in reality over the longer period, it actually picked up. Seems more erratic waves in there as well. Drops sometimes happen around bigger quakes and sometimes not and when they do take place, they are much steeper than before in curve, followed by a swoop back up. And yes, I know, staring at a GPS chart is probably not the greatest way to track a volcano. It could also be rotting my brain, but time will tell 🙂
today is 23.5 days from start of recording, not 18 which gives 0.396 m/day
Ah, you are correct. It was 18 before… so it is flattening some for sure! Lesson one: never use previous data to create new data if data sets are changed. Good walkaway for the weekend! 🙂
GPS stations around Big B and to the west and south are showing signs of inflation again, just like in mid-Sept we saw deflation only to have it recover again. This should increase the supply of magma and the dyke, and/or Big B could POSSIBLY erupt significantly with the added pressure because stations nearest current eruption are not showing a trend towards deflation as they did in back in Sept. Another surge of magma in the system could create new activity. Now I’m just looking at the trend of up and down movements here. Lateral movements have been erratic at times with the flexing of the crust, and some of that is due to GPS error on a daily basis, but trends one way or the other do emerge. This next week should be an interesting one if a broad inflation trend is emerging here.
Secondly, the tiny eruptions that have happened under the glacier and maybe one going on in the caldera brings up the subject of “where has the water gone”?. Probably down. Why? Rifting produces a lot of fracturing in the crust, and the big quakes in Big B most certainly are. Water is very good at finding those cracks, even tiny ones, and getting pulled down by gravity. And there doesn’t always have to be great explosions every time water and magma meet. If that were the case, we would have seen them already, back when this event started. The circumstances have to be right for that. And it could very well be the case that most of the water entering, or has entered, the ground isn’t even in touch with magma yet.
An eruption inside the caldera will see the water stay in the caldera. The rim of the caldera is about 700 meters above the bottom. Water would have to get to 700 meters deep to spill out of the caldera under the glacier. Water that is that deep and that cold will not allow steam formation There will be no flashing of water to steam at that pressure. The magma would erupt out of a fissure, water would be heated and quickly convect upward being replaced by cooler water. The warm water coming into contact with the ice above would melt more of it. Glacial ice contains a LOT of trapped air. It loses a lot of volume when it melts. So I believe the water is sitting inside that caldera as a sort of sulfuric acid soup. It would take a very long time to melt that ice cap (melting a mass of ice 800 meters deep (at the deepest point) and 10 kilometers across takes a huge amount of heat). It is quite likely that such an eruption could occur for many months without any surface indication other than dropping of the level of ice in the caldera. It is likely that it would stop erupting before completely melting it.
Over the very long term (in geological timescales) that acidic water would react with the rock and degrade it. A worst case scenario with that would be the degrading of the rock in the northeastern rim of the caldera, it gives way, allowing the caldera glacier and water to spill out. We see something similar happen in volcanoes in the US Cascades such as Rainier where SO2 is absorbed by ground water creating sulfuric acid which reacts with the rocks and weakens them to the point where they give way.
dont forget that the water can go uphill too….
The other thing that is linear is a temperature relationship,this is not a pressure situation?
Could you explain this a bit?
I am thinking the shallow chamber under the caldera contains a viscous magma,possibly rhyolite.This magma was prior to the current activity in a relatively cool ,solid state,as hotter basalt has intruded from greater depth into the caldera magmatic system it has raised the temperature of this viscous magma body,causing dome building under the NE caldera rim.This change in the thermal gradient of the upper chamber is driving the earthquake activity ,the hsating of the chamber is releasing energy through the surrounding rock.In effect a giant heat engine.But no expert here,just thoughts to ponder.
Thank you. Very interesting. 🙂
I am a little annoyed that what I was afraid would happen is happening. That is, persons who are trying to interpret the recent slow-down of the fissure eruptions, together with the weakening of the earthquakes within the caldera and apparent slight flattening of its top, interpret it to mean that the eruption at Bardarbunga is slowing down and headed for a halt. May I remind you that as I learned in a previous Frimann report blog, the most realistic interpretation of this very recent phenomenon is that the previous methods the volcano employed to release increasing magma pressure from below, are reaching a tipping point of having gone as far as they can. And therefore the pressure within the volcano caldera is building up – increasing not diminishing This is where some science here would be a big help – electronic measurement of conditions within the caldera. Even photos of what is showing on top of the caldera day-by=day so comparisons could be made and surface developments closely monitored, would be very valuable.
I seem someone posted a new magma chamber diagram on VC,showing 3 magma chambers?I think I might have to be clearer with my posts in future,so they represent my ideas correctly lol.Yes I do still read VC,so thanking “Geolurking” for their compliments!
You mean that in hindsight it was not so good an idea to use a golf flag to indicate the GPS in the middle of a sinking caldera? :wink;
Yeah I did not think they would take my golfing analogy so literally lol
Pflueger says:
“1/b gives you the time constant. In this case, about 50 days. I.e., in every 50 day period, the curve value will decrease to 1/e of its value at the start of the period.”
you are right about the math level but volcanology is not all about math. All of the rocks composing a volcano is not homogeneous and therefore no one can predict what will happen. We can only work with assumptions and probability calculations
Yep – I understand that there’s far more at work here.
By the way, don’t take my prediction too seriously. I certainly don’t.
It is interesting, though, how a relatively simple model both mimics what we see from the subsidence data *and* has a plausible physical representation (Bardarbunga – acting as an accumulator – connected to Holuhraun – acting as a valve – through the dike with marginal perturbation from below with respect to material influx).
We will see over time — it’s certainly fascinating to watch.
– JCPfl
Thank you Jon for all your updates, you keep all of us so very well informed. Take a well deserved break.
I would be interested to see another one of these Lidar flights done. This was another data point that helped me form my conclusion. You will notice a rather significant amount of uplift under the ice along the caldera rim on the northeastern quadrant. Then to the southeast you see the greatest gradient of decline in the caldera ice. That area is also the deepest part of the caldera and the area where the column of quakes meets the surface. We are also seeing an increase in quakes at less than 2km depth (and seeing several per day at less than 1 km). If I saw no movement above the caldera on that northeastern rim or slight deflation, I might be tempted to go along with the “caldera collapse” idea. But the inflation there leads me to suspect (and this is *only* suspicion on my part and want to label it as such) there is a dome building event going on under the ice where we are seeing that “deflation”. We are seeing the ice melting, in my opinion, and there is a LOT of it. Such an eruption at the bottom of it could go on for a long time without showing any signs of it on the surface. I think that depression is the formation of a very large cauldron.
I forgot the link to the diagram I was referring to in my previous post.
http://earthice.hi.is/sites/jardvis.hi.is/files/myndir/Bardarbunga/2014-09-08allt-residulidar.png
How nice it woud be if instead of pictures IMO would publish data.
The larger earthquakes on the north caldera rim are centered where the mild subsidence there is. NOT where there was mild uplift.
http://en.vedur.is/earthquakes-and-volcanism/articles/nr/2949
Your theory of melt instead of subsidence just doest hold water. It doesn’t explain really ANY of the observed data.
Lava in contact with water is on way of generating low frequency tremor. This was observed in the subglacial eruption that made IMO issue a red warning. Such observations have not been made since. There is no substantial body of evidence that supports any subglacial eruption at present. Your hypothesis of subglacial melt causing the depression is not corroborated by any other observable and so it is pointless to continuosly make it.
I have been doing some crude modelling of what would happen with an eruption in the caldera bottom, using a range of values for glacier ice density, and other figures found on the web. If I assume that *all* the heat in the magma goes to melting ice, and the water produced stays in the caldera, then the volume of magma needed to produce a given depression is between 0.33 and 1.28 times the volume of the depression.
But lava is a very poor conductor of heat: if only 50% of the heat melts ice, then for the densest ice modelled, the eruption causes swelling, not depression, and if only 20% of the heat melts ice, the eruption causes swelling even for the least dense ice modelled.
My conclusion is that, under the conditions modelled, there is no such eruption.
Is the caldera rising now? The subsidence graph seems to be going in the wrong direction.
In an exponential-like shape that seems to have happened a couple of other times recently. Interesting. Headed back down now though.
I just saw a shooting star on http://www.livefromiceland.is/webcams/bardarbunga/ ! 🙂
Is it me or is the cone collapsing?
Could be, looks like a breach to me.
Yesterday night, someone also remarked there could have come a breach into the cone, maybe it has widened now.
When the rift activity picked up initially, I noticed that the right side of the cone seemed to have a “bite” out of it with the lava flowing out of it and to the left compared to the previous day. I only noticed it because of the combo of wind and light that made it easy for me to see.
**I’m not contradicting the official reports of no additional flow rate by saying the activity “picked up”, just describing the apparent increase visually.**
If heated from 0 to 1000 C ice will initially contract 7% to 4 degrees then expand 21% up to 1000C a net expansion of 14%. Your hypothesis is disproved.
what’s the orange glow in the middle of cam 1?
From the flare I just saw, it looks like another rift, but since it didn’t stay high and bright I cannot say for sure.
Reflection of the glowing lava flow in the gas clouds?
I was wondering the same.
Is that part of the dyke covered by cam2? If so where and why does it not show up? Is it where the dkye snakes?
It does not seem to be joined to the ground?
Maybe smoke illuminated from below by exposed hot lava.
Could be, but you can’t see it, it is underground. What you see is just the lava channel.
“If heated from 0 to 1000 C ice will initially contract 7% to 4 degrees then expand 21% up to 1000C a net expansion of 14%. Your hypothesis is disproved.”
I am not talking about thermal expansion/contraction. I am talking about the loss of volume from a lot of trapped air. Glacial ice has a lot of air in it. A good portion of its volume is air bubbles. When the ice melts, those bubbles escape and make their way out, mostly along the edges, particularly when you shake it from a quake.
Additionally, the water isn’t going to get much above freezing until the ice has melted. The lava will heat the water which will convect rapidly upward hit the ice, cool, and fall to the bottom again. Ice is a pretty efficient coolant in a convective system.
The last should have been an answer to Graham 00:20
Whatever it is I can’t stop looking at it tonight. It’s so beautiful and awe inspiring but so powerful and dangerous at the same time – compelling viewing
Thanks. 🙂
Re. the orange glow, this could come from lava pools where the lava flow is partially obstructed, dammed up and hotter. And the lava comes in pulses, could be a phenomenon like this here in Hawaii (source: USGS):
http://gallery.usgs.gov/videos/156#.VC8k7hZ-3N0
The pulsing is well to be seen in this video of Holuhraun:
https://www.youtube.com/watch?v=fmCJSS2YAP0
I believe that is what is happening. The glow from the lava is illuminating fog / low clouds.
Thanks, that would explain it then with the low clouds. It was a fairly brief flare, time span of minutes with an “afterglow” in the smoke column shrouding the area. The interesting part was that it was competing with the eruption site for size & brightness when I kicked over to make my initial comment, but by the time I was back a few minutes later, it was only a bit of extra glow in the clouds at that location.
It’s uncharacteristically dark at the waterfront property.
Those of you who are impatiently waiting for a fresh flyover, it´s possible you have to wait a few more days. There has been stormy weather in the last few days and it´s ongoing. Another factor is bad visibility, which might be a problem. As I understand it, the scientists are waiting for an opportunity to fly over to take a look, but it´s unclear when this is going to be possible. So I guess we´ll just have to wait a little longer.
Tomorrow and especially Sunday look OK for flying and clearer weather. They’d have to do it then.
Cam2 – I think the brightness of the cone is MUCH bigger and brighter than it has been recently! :O
The moon is out, reflecting in the river below.
I can see a second plume on camera 1 . 25% from the top, 50% from the left. Looks like it’s up on the mountain.
The distant cloud behind the mountains at the right of the image (BB camera 1) seems to be becoming a brighter orange, as if it’s reflecting light from magma.
forget this post, just high cloud over existing fissure.
Still think I can see a second plume.
These clouds can also originate from small explosions when a lot of magma meets the river resp. parts of it.
At the moment eg. at Mila1 cam, to the left.
New SO2 map from IMO
http://www.vedur.is/vedur/spar/gasdreifing/
(experimental, not sure the data is valid yet)
Was looking for papers about what happens to air trapped in ice during earthquakes and didn’t find anything (I’m just a beginner when it comes to more serious volcanology and don’t know much at all about how to search through scientific papers so not finding it does not mean it’s not there) but I did stumble over something pretty cool, which I’ve only skimmed so far, about the 1996 quake and what their theoretical analysis and modeling of it told them about the eruption and shapes of the objects in the caldera. http://www.geo.uu.nl/~seismain/pdf/2010_Bardarbunga_EPSL.pdf
Yeah it would be nice if IMO released the data along with the pictures. I once tried to compare IMO’s site favorably with USGS, and got shot down solely on that basis — USGS shares datasets.
I want to make beachballs!
You could find earthquake data on the weekly lists:
Jarðhræringar -> Jarðskjálftayfirlit -> Vikuyfirlit -> Skjálftalisti
(IMO, Icel.)
wow: U of Iceland tweets:
Univ. of Iceland @uni_iceland · Oct 1
Quick back of envelope calc: 48.2 x 14m (apprx. avg. thickn) = 0.67 km3 volume / 32 days = 242 m3/s avg. effusion rate (~3.7x river Thames)