As the eruption in El Hierro volcano moves closer to the second month. Information on what has been going on has gone bit hard to come by (for me anyway). As people settle with there new reality (erupting volcano). But that does not stop me from reporting on it.
The current status of the eruption is that nothing much has changed since last blog post. But yesterday there where reports of new vents opening up off the south coast of El Hierro volcano. But this is the area where current eruption has been taking place the past month and a half. It remains to be seen if that is going to change or not. But earthquake activity has continued in north part of El Hierro volcano. This earthquake activity seems to be a mixed one. But that means there are both earthquakes due to dike intrusions and local tectonic earthquakes. I now think that this earthquake activity is going to continue all the eruption. I am not sure why a eruption has not started in north part of El Hierro volcano yet. But for the moment it is just earthquakes. The strongest earthquakes in this area can go up to Mb5.0 in size. But I base that on what type of rock makes up the area, along with the thickness of the crust. But that is from 10 km thick.
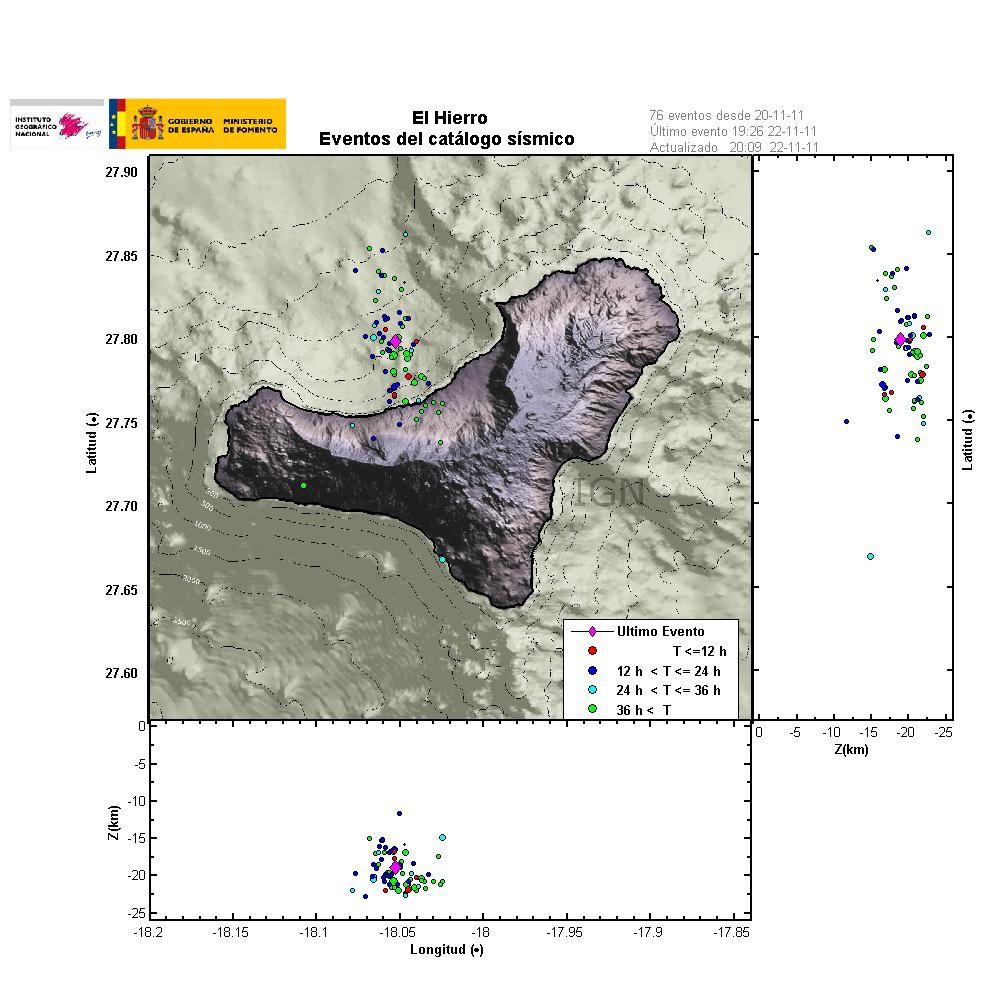
The earthquake activity for the past 48 hours in El Hierro volcano (picture from 22 November, 2011). Copyright of this picture belongs to IGN (Instituto Geográfico Nacional).
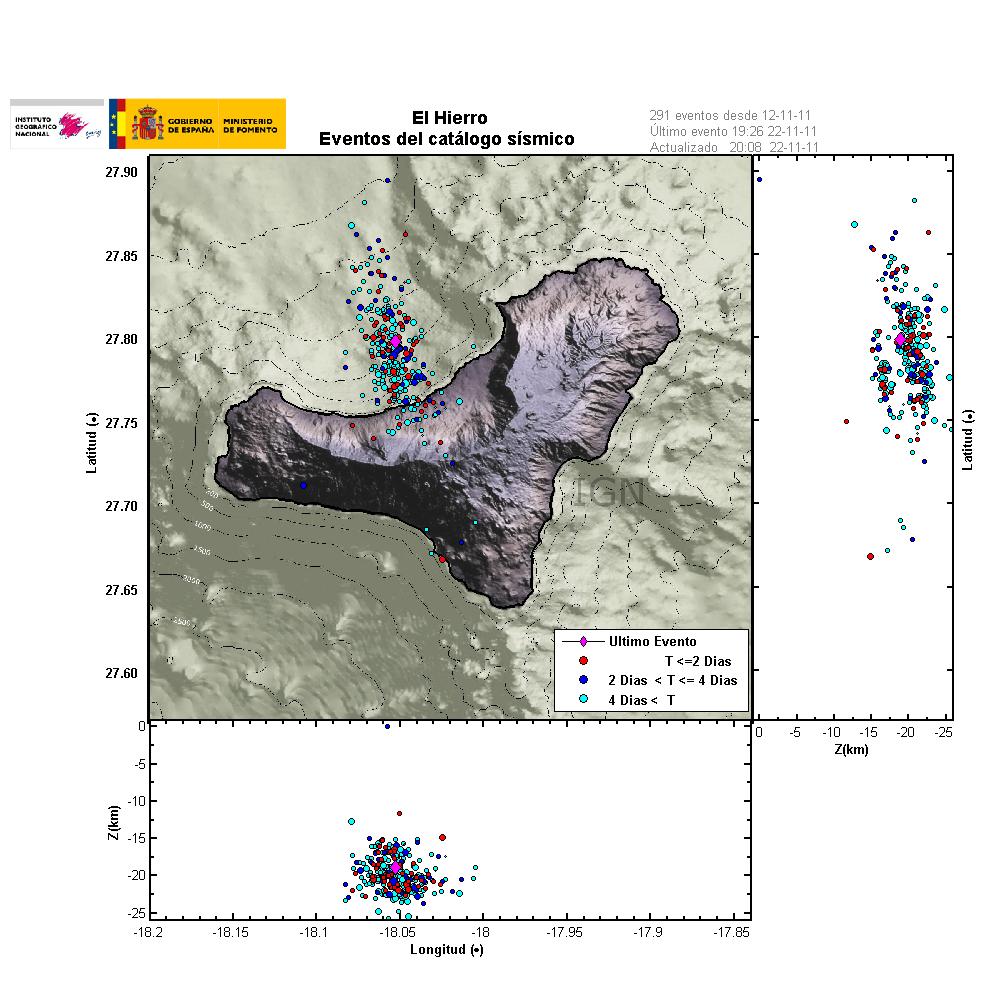
Earthquake activity in El Hierro volcano for the past 4 days. Copyright of this picture belongs to IGN (Instituto Geográfico Nacional).

The earthquake activity from July 2011. This earthquake activity maps out well where the magma lies in the El Hierro volcano. But as the magma expands in the crust, it creates earthquake activity. Copyright of this picture belongs to IGN (Instituto Geográfico Nacional).
The harmonic tremor tells me what is going on in the eruption, when I lack all other visual data on what exactly is going on. But the harmonic tremor increases or drops depending on the strength of the eruption. But that aspect of the eruption is based on how many and how large fissures are open at the time.
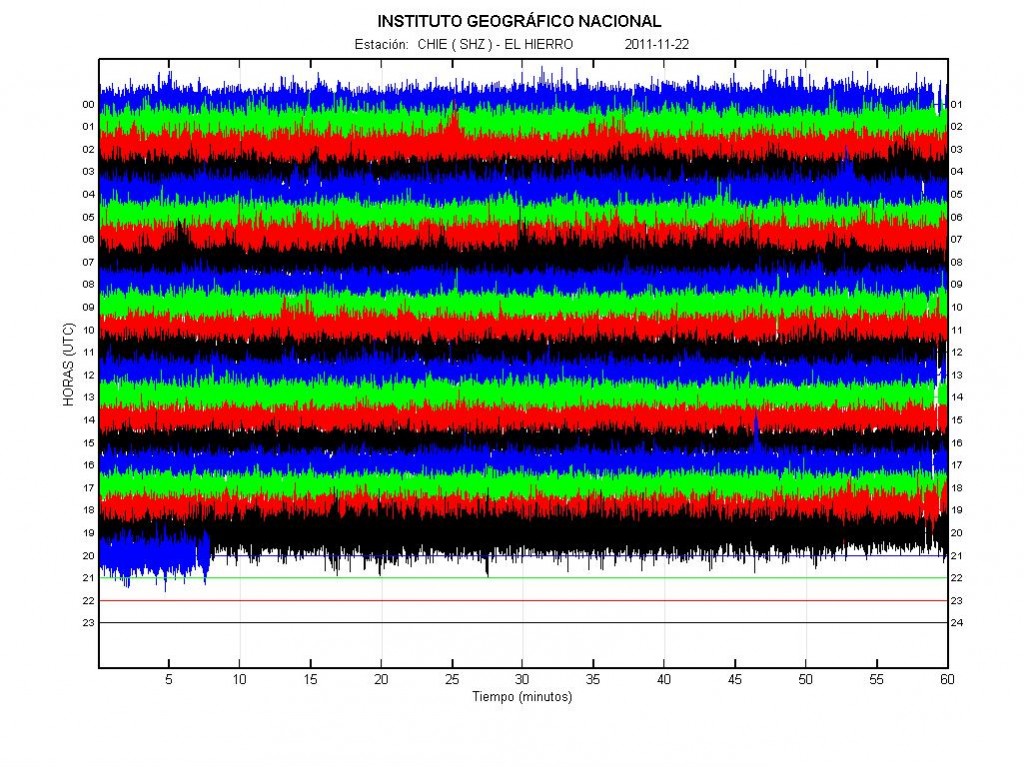
The harmonic tremor as it is today (22 November, 2011) at 21:11 UTC. The eruption as can be seen is around the same level as before. But this is not the strongest the harmonic tremor has been. Copyright of this picture belongs to IGN (Instituto Geográfico Nacional).
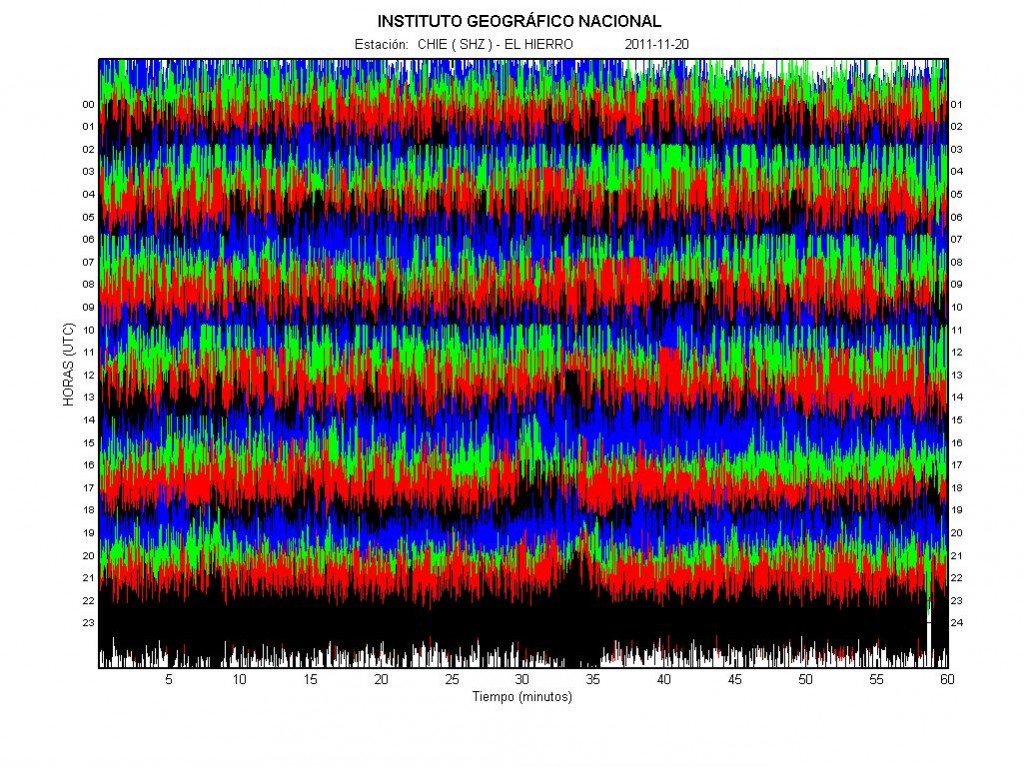
The harmonic tremor when the eruption was more active then today. This can clearly be seen by how the harmonic tremor is stronger then the scale of the harmonic tremor plot. This happens when a new fissure opens up and its eruption is at the strongest. Copyright of this picture belongs to IGN (Instituto Geográfico Nacional).
The IGN web site on El Hierro volcano eruption can be found here. But it is in Spanish.
I am continuing to monitor this eruption. Even if it is a long term eruption, but that are eruptions that are longer then 1 month. As the for the eruption as a whole, little change has taken place in terms of strenght and location of the eruption. But that might change without warning as before.
There seems to be inflations near the middle of the southern E-W leg of the island. Coupled with the apparently increased CO2… Dunno.
Landfall?
It might well be. Fissure eruptions often have inflation few days to hours before a eruption starts on a new fissure.
What town is closest to that area ?
Where does an inflation of 1.5mm come in the scale of such things for example compared to the eruptions at Eyjafjallajokull.
Eyjafjallajökull volcano did inflate 60 mm before it erupted. In Krafla volcano inflation and deflation was measured in meters (hundreds of mm) when magma moved around.
Lurking’s plot is suggesting 1.5mm per day for the last 11 days – so total inflation approx 16.5mm at the reddest spot
I know that Sabinosa is on the North face and to the west.
http://i42.tinypic.com/1zlxbew.png
The elevation data is from the Nagoya network, elevation change is in decimal part of a meter.
And Frontera is the NE of the elevated area,
My first attempt at 3D plots and video making: http://www.youtube.com/qD4vgbouvEE
plot of EQs from 19/07/2011 to 20/11/2011. Magnitude is colour-coded.
A better link:http://www.youtube.com/watch?v=qD4vgbouvEE&feature=youtu.be
Nice.
Now if you can bring the quakes in closer to the viewer you will be gold.
Thank you. I’ll have a go with the zoom; I had been trying to enlarge the plot area, with limited success.
Maybe silver this time:
http://www.youtube.com/watch?v=RQESFUkpjx8
3d plot updated as at lunchtime today.
And I aint gotta clue Karen or Lurk, but we HAVE to start plotting the stuff above sea level.
Reason for that is that if it continues either Restinga will come popping to the surface and rise out of it and its going to be very dicey to plot that mug, or it will walk up out of the sea onto land either at Restinga or El Golfo. Or it will make land that will demand it of the plots.
You guys are COOOL with this stuff in my book. If I had time to try I would but its Xmas and its airplane time for the stuff that didnt make it for Black Friday.
Keep it up ! I am watching.
You can’t do above sea level unless the quakes are above sea level.
If you have a line on a different datum reference, I’m all ears.
The othe problem is that the shallow stuff is probably gonna be small, and rumor has it that they are intentionally not putting the small ones in the list anymore.
Seems to be some truth in that rumour as it is hard to believe that there have been no EQs <1 at the moment. But with a harmonic tremor that appears to be on steroids, distinguishing the smaller ones accurately may require more resources.
Or alternatively they may have taken the smaller ones out of the picture to focus on the larger ones. Could be a big mistake as the shallow ones so far have been smaller; they may be key to spotting where the magma is.
So, you know I have resources. UofM…..
They suggested that you simply raise the bar on the level. There is of course no lat/long on the altitude for the plots but that you should set an arbitrary height into the plot. You have already done it mostly with the picture of the island on top of the quakes which are happening mostly below sea level. Use the altitude of the mountain as the zero line with it showing sea level at whatever the height is of the island in an area. The program they said might not do it that way but you can use the hightest peak in El Hierro as zero, then plot off of that.
So for now I said we got about 3 different colors showing quakes.. What about that?
Color coding-The math dept says that they run into this a lot for delineating what is and isnt a perturbation… Not a quake for them. They run point in space calculations as part of geometry and they have to assign points by colors because its actually the same thing as using it as an astronomy program. They put their little calcs in to suggest a star, moon, asteroid might be in a place at a certain time and its graphically plotted for a block of space and time. If it shows, the Nobel. If not, the calcs were off and they simply go back to the drawing board. The important thing they said is that they have no baseline in space, so they use effectively what is fixed in an area. A sun/ a moon whatever thats on a known trajectory or is fixed in space. 2 points and a 3, then another to create the 3 points for verification.
Makes sense to me. So whats fixed there roughly? The peaks.
Very esthetic as a cherry on the pie. Bravo.
Corrected and updated version:
http://youtu.be/nxq8ccrozoM
Continuous GPS Observation in the Canary Islands for Volcano Monitoring
SAGIYA, Takeshi1, BARRANCOS, Jose, CALVO, David, PEREZ, Nemesio, HERNANDEZ, Pedro, and FUJII, Naoyuki
http://www.seis.nagoya-u.ac.jp/sagiya/Sagiyas_Page/English_files/100601COV6.pdf
There seems to be considerable ~6 month fluctuations indicated in the PDF poster cited above. Hindsight is so easy …
Significant?
A fluctuation like that is what is needed to bolster the Sun connection. In this case, it’s probably the Sun connection to the mount or building heating up on one side.
That would be my guess. The signal doesn’t seem to show up anywhere else.
The published EQ activity prior to 2011: http://oi44.tinypic.com/2hxav6x.jpg
Red Light, Level 1, in the Restinga (El Pinar)
Yellow light in the rest of the island
In consideration that the risk of volcanic activity is complex there are a series of actions that develop sequentially. Therefore a worldwide warning system has been established for the population based on the selection of three colors (green, yellow and red).
In this way the population may adopt certain behaviors based on the symbols that are easy to understand by color. We all must adhere to those alerts and the recommendations relating thereto.
Has anyone considered that there could be an underwater fissure eruption North of the island? With sufficient depth and current, there might be no signs of it on the surface.
In my opinion, its already happened. IGN won’t admit it.
If it hasn’t happened to the north, one may well be pending – either there or on land.
Or to the south.
Amen…..
It shoals off to about 8000 feet out there in places and well, something short of a nuke could likely go off and not have too much of a surface signature.
Dunno. This could be turning into a multiyear eruption and have features from everything we have seen elsewhere. If that green is there, its erupting under the water or seeping enough to do it. Hence the changes in the colors between the two and the direction of travel of the plumes.
That spike in etna’s sismogramme it’s because of the 5.5 earthquake in Greece?
Bob is very busy today, with 3 or 4 mouths and “la mancha” expanded very fast and had ready touch the land in La Restinga dock. The webcam was very animated this morning. One EQ 2.6 13km depth near La Restinga.
linked from Carl’s blog- analysis of ‘restingolitas’
http://www.ign.es/ign/resources/volcanologia/pdf/Informe_petrologico_erupci%C3%B3n_Hierro.pdf
And a breakout of the analysis via KWare’s Magma program.
http://i40.tinypic.com/1194f7q.png
And the truth shall set you free.
I am not sure what they were sampling Lurk but the five were from left to right.
1 Silicon Oxide, 2. Titanium dioxide…Now here is an after eruption thing they might want to go for. Ferro titanium dioxide is going for 700 bucks a ton. 3. Aluminum Oxide goes for .85 an ounce 4. Iron Oxide 5. Hematite I think. 6. Manganese Oxide 7. is Magnesium Oxide. 8. Calcium Oxide 9. Potassium Oxide 10. Phosphorus Pentoxide 11. Oxynimul Water (Interesting… Never heard of this one) 12. Dihydrogen monoxide. 13. Rubidium 14. Barium.
Lurk I think they cut this as a 1986 study showed loads more types of rare earths on the island near Fuerteventura, mine quality stuff. No gold or silver but loads of everything else.
Hmmmm? !
Interesting “views/scenarios” of the EQ-“clouds” from todogeologia.com
http://tenerife.todogeologia.com/viewtopic.php?p=9593#p9593
Not bad… but take that with a grain of salt.
Those “blobs” show that the authors interpretation is that the quakes represent the extent of the magma area.
This may or may not be the case. IF they do represent the extent of the magma area, then at what point do you place the surface of the blob? 68% boundary? (encompassing 68% of the quakes) That would be one standard deviation.
An alternative idea is that the quakes represent the top of the magma areas and are the feeders seeking new areas.
It’s good that other people are exploring visualizing this using the CG capabilities of our computers. Some of this is a direct offshoot of online gaming and modding. The rest of it is a quest for knowledge.
Good link. Great graphic!
I must always remind myself that this is a try to understand what’s happening in the earth. And, as i learned, that a magma chamber is NOT a great hall filled with lava. Thanks for your advice.
Interesting plot.
You can get A LOT of up-to-date info on El Hierro activity at this web site:
http://earthquake-report.com/
(click on the El Hierro link on the front page)
It also includes links to web cams in the area, as well as pictures from other sources.
latest volcano activity (web page is constantly updated): http://earthquake-report.com/2011/09/25/el-hierro-canary-islands-spain-volcanic-risk-alert-increased-to-yellow/
webcams: http://earthquake-report.com/2011/11/12/32535/
Yeah, he’s been in here a few time sourcing his material.
Site is too busy for me. Hard to track down something specific.
Some have stated that the entire island of El Hierro could erupt. Is this in the cards?
Technically speaking the Island of El Hierro is erupting. It is just not above the ocean yet.
Heh… I always get a kick out of that. I remember one guy that popped up on Eruptions and predicted an eruption at Etna… which had already been in a state of eruption for a few years.
(Dunno if Boris was amused or not)
Eh-depends on how you look at this Larz. The entire island could erupt? Not likely but if it breaks into the inner workings of El Hierro there are going to be vents popping up all over the place. IMO I think thats happened before. Its kind of nutty but I couldnt find a single hot spot that you would normally expect with just about any other volcano.
This island is described as the island of 10,000 volcanoes and there are thousands of vents there but no heat until recently. Like 90 quakes before July in the last 10 or 20 years.
But if it does get into the dikes, the lava tubes, the collapsed cave structures you just wont know where its going to pop out mostly because they are open at the top.. No pressure, no quakes and it could rise quietly and just show up.
I thought it was extremely significant that the Co2 levels are still rising. Dont get that unless something else is happening and Gitta at Eruptions has a tube of a new vent opening off of Restinga.
That big blob of supposed magma in a chamber really likely doesnt map out the chamber or the conduits. They could be right below their feet in Frontera and they wouldnt know it. Its just not what we are used to. It goes without saying that it wont happen in a vacuum… If its going to go its going to go quite noisy and very likely with no warning. A big quake, a flank failure and all sorts of bad news could come to the top very quickly.
Do get out a topo map of the place and you will be amazed at the number of named vents and the thousands that arent.
I just think that if it gets into the island that its going to exploit the plumbing and its going to pop out all over the place.
New blog post is up! 🙂
Raised an eyebrow hearing news of an explosion on the Canaries., but it was an accident during propane delivery to a hotel. Condolences to the several injured with serious burns.
http://hisz.rsoe.hu/alertmap/site/?pageid=event_desc&edis_id=EX-20111123-33146-SPI
Update 25/11 – 13:32
– PEVOLCA has decided that all evacuated people are allowed to return to their houses. As the La Restinga people were already allowed to sleep at home, this decision was taken to allow the return of the families of the Las Puntas area who had to be evacuated after the M 4.6 earthquake from a couple of weeks ago.
Pevolca maintains however the Red Alert for La Restinga (municipality of El Pinar) and the yellow alert for the rest of the island.
The only Civil Protection extraordinary measures that are currently maintained is the closure of the beaches of Puerto Naos and Tacorón as well as the maritime NO-GO area (radius 4 km).