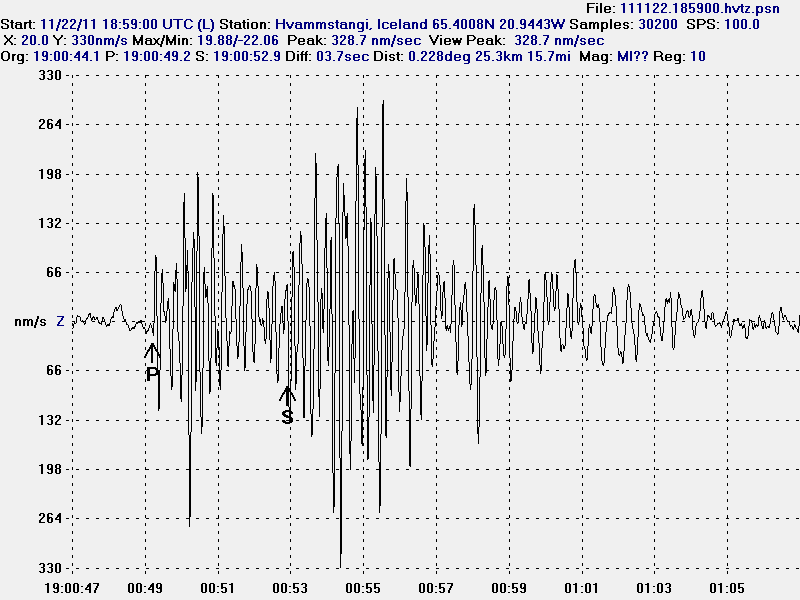
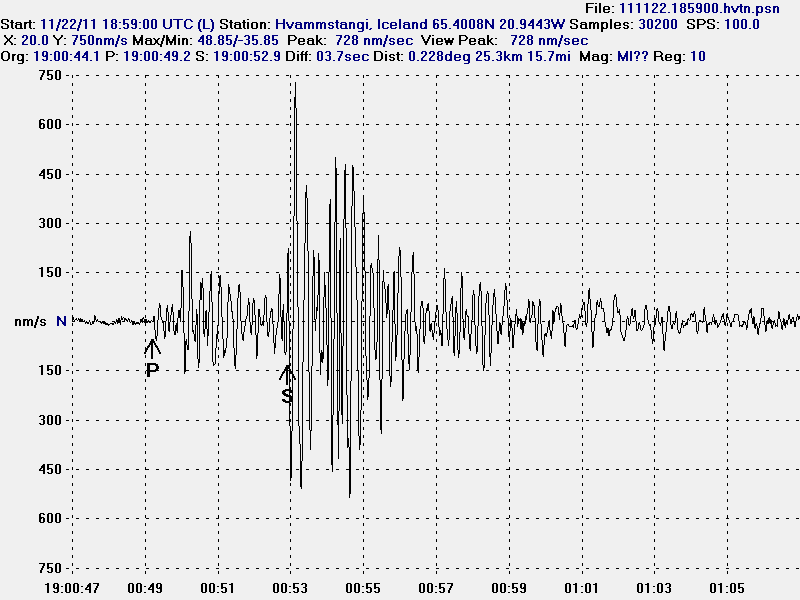
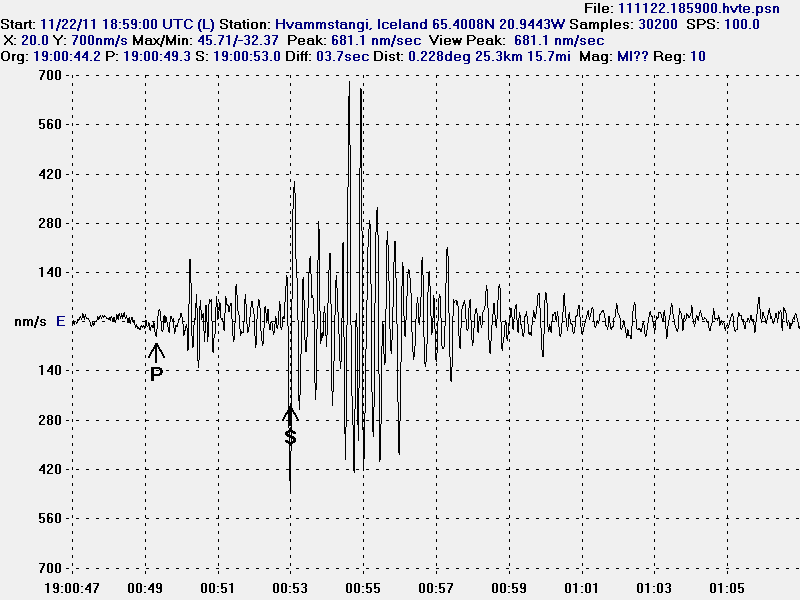
A rare earthquake took place yesterday close to my geophone in Hvammstangi village. But that village is located in north-west Iceland. This earthquake was small and I do not have location at moment, as I only have one geophone at this location for recording earthquakes.What I do know about this earthquake was around 25 km away from my geophone, with the default depth at 10 km. But this distance is a bit inaccurate due to default depth factors. So this is just a best effort guess. But what I do have is the wave form of this earthquake.

The vertical (Z) component of the earthquake. This picture is released under Creative Commons Licence. Please see the top bar for more information.

The North-South component of the earthquake. This picture is released under Creative Commons Licence. Please see the top bar for more information.

The East-West component of the earthquake. This picture is released under Creative Commons Licence. Please see the top bar for more information.
All the pictures here above show the 20 seconds wave form signal of the earthquake. I have marked the P and S wave of the earthquake in order to figure out the distance this earthquake took place from my geophone.
In this area I get around one to two earthquakes a year that are local and do not appear on the Iceland Met Office earthquake list. But that happens because there are few to none SIL seismometers in this area and IMO can only detect earthquakes that are larger then ML1.5 to 2.5 in size.
If I get a location on this earthquake, I am going to update this blog post.

Thanks for the plots.
Is there anywhere I can get digital data for an earthquake with z/y/z components, I wanted to have a go at turning it into stereo sound, pitch shifting to get it into a human audible range, and probably put the vertical component on one channel and the horizontal components on the other, should make for an interesting experiment, though I’m sure it’s been done before.
You could always pull down the seed file for a quake from Iris Bud. It takes a while to find a specific seismo, for Iceland, I think only one station provides seed data to Iris and it’s in Reykjavik. For the Canaries IU:MACI is the station.
Anyway… you download the seed, pull it into a program a like SeisGram2K so you can look at the different components. SeisGram2K is designed for analysis, but it does have the option of saving the waveform out as a wave file. Typically is shifts the freqs by a factor of 50, so you don’t actually get the raw quake, but somethign up in a range you can actually hear.
If your audio application and equipment you can save it out a scaling of 1 and drive the raw frequency through your system… you won’t hear anything, but if your gear is strong enough to handle it, you might knock a picture off of the wall.
http://www.iris.edu/data/bud/
http://alomax.free.fr/seisgram/SeisGram2K.html
i should RTFM, but here goes a question: can we get all the seismic data, or just the seismic around the the earthquake incident … I would be neat to to try some filtering and cross-correlations between stations to see if you could pull a little more out of the data (ie fainter Earthquakes, better times, etc ..)
In Bud, you can pull the whole day if it’s there for the selected stations.
@Jon.
I’ve been working on a spreadsheet formula for calculating the distance of a straight ray path from the hypocenter to the recieveing station. It’s preliminary right now, but when applied to the arrival times of stations in the Canaries, I’m getting some really nice travel speeds that are in keeping with expected P-wave velocities.
If I can figure it out I’ll post the equation here.
Thanks for this Lurking. It is going to be interesting to see what comes out of your work.
Do you use Excel? If not you will have to transcribe it for your spread sheet program.
I think I have a good version now. I need to run a few more comparisons but it seems to be dead on.
I did a plot using the IUG Earth radius and known station distances, then did the measurements with the graphing program.
The Excel formula is hitting the graphically measured distances quite well.
I do not use MS Office Excel. But I do have LibreOffice excel. But there are differences.
That’s why I put the cell formulas in the columns they apply to.
It’s pretty straight forward. RADIANS( ) converts a degree measure to radians, DEGREES( ) does the opposite. {naturally}
SIN, COS, etc are how Excel refers to trig functions (ASIN being the inverse), and the site where most of the trig stuff was derived from is in the graphic.
LibreOffice/OpenOffice would open most Excell docs if they do not contain macros or Microsoft Visual Basic scripts. If Lurking creates a Excell doc, with out macros, for you and/or other :O) We all should be able to open it from Linux, Windows and Mac OSX.
Good work Lurking ;O)
What you will be looking at is the actual free space path. Once you have a lock on the event time, you can take a look at the arrival times and get a really good read on the material in between based on propagation velocities.
Seems to work quite well.
To overcome the program comparability issues, I just put the cell formulas over top of the cells that they are for.
The inputs are in green and are the angular degrees of separation from the epicenter to the station in question. This usually shows up in quake detail info from some organizations, but can be calculated by: Distance (in km) / Earth Radius = angle in radians. Convert to degrees (1 radians = 57.2957795 degrees).
You can prune or tweak that to fit your needs.
The output of the sheet is in blue. The red are cells that are either constants or are calculated. (the only constant is the IUG Radius)
Your mileage may vary.
http://i43.tinypic.com/20idzsg.png
I seem to have cut off the column labels.
There are no hidden columns, they run sequentially a, b, c… etc.
Good pictures of the p- and s- waves.
Everything seems quiet in Iceland, but a small detail that caught my attention in the Hekla tremor of the red line has barely BUR oscillations, is attached to 0, has always had fewer oscillations than the other ut not so straight, it is surely normal, do you think?
http://hraun.vedur.is/ja/hekla/borholu_thensla.html
Cloning didn’t work on the hard drive. So I have to setup Windows XP on it from the start. That is going to take a few hours at least. But I am now copying the data to the new hard drive (just not the Os).
Good luck.
use ubcd4win to repair/reaccess, change passwords forgotten, etc etc, cloning, partition resizing on active partitions without losing the os
http://www.ubcd4win.com/
I have already cloned the hard drive. See the latest comment from me on the end of this comment thread (at current time).
What is going on at Svartakot?
http://hraun.vedur.is/ja/oroi/sva.gif
I assumed it was a glitch due to the obvious technical error, but it’s definitely now showing a pattern of harmonics similar to kvo and the other stations around Krafla. Is this likely to be a result of changed settings at the SIL, or is it a change in seismicity? If the latter, what’s likely to be causing it? It doesn’t look like a good area to be picking up harmonics in…
http://support.wdc.com/product/downloaddetail.asp?swid=119&wdc_lang=en
Use this to copy partitions…
Thanks. I totally forgot this program.
Please note that this weather forecast map is for Friday at 00:00 UTC. I do not think that the SIL stations are going to look settled with this weather off the coast of Iceland.
http://esv.blog.is/users/da/esv/img/hirlam_urkoma_2011112318_30.gif
That storm system is expected to give plenty of snow to Sweden and Finland on Sunday and Monday.
Good news. I did manage to clone the hard drive with the program from WD web site. Everything is now up and running again on a new hard drive. 🙂
When will you get your Katla geophone up and running?
The plan is to have both Eyrarbakki geophone and Katla volcano geophone up and running in December. I finish school on 13 December, 2011. So it should be soon after that I hope.
That is if everything goes according to plan.
Strong swarm taking place near Grimsey. Most likely tectonic.
Tectonic?
Why so certain?
http://www.volcano.si.edu/world/volcano.cfm?vnum=1703-10=
There is no volcanic activity in that area. It is just tectonic.
Huge Spike at GOD: http://hraun.vedur.is/ja/Katla/god_trem.gif
This is a earthquake.
Thursday
24.11.2011 15:39:13 63.630 -19.190 1.7 km 2.9 99.0 3.2 km ESE of Goðabunga
New blog post about the activity in Grímsey Island is up! 🙂
Hey im really interested in these posts! Jon keep up the good work, im behind you all the way! How far do detailed records go back for the periods of activity for icelandic volcanos and earthquakes? Just interested.
You can see the known documented record of volcano and earthquake activity here.
http://icelandgeology.net/?p=745
http://icelandgeology.net/?p=765
Here’s a link to data for Katla at the Global Volcanism Project.
It goes back about 8,000 years.
http://www.volcano.si.edu/world/volcano.cfm?vnum=1702-03=&volpage=erupt
Wow thanks 🙂