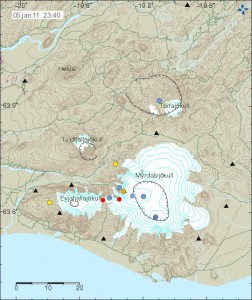
The seismometers that British Geological Survey did pay for to be installed around Eyjafjallajökull volcano and Mýrdalsjökull (Katla volcano) have been integrated into the Icelandic Met Office SIL Seismometer Network. They have at least been marked into the Icelandic Met Office earthquake web page.

Image is from Icelandic Met Office. Copyright of this picture belongs to them.
The new stations are marked with a triangles on the map. The older SIL stations can be found at Icelandic Met Office tremor web page. Currently the new SIL stations are not on Icelandic Met Office Tremor web page yet.
What this means for earthquake recording in this area is that Icelandic Met Office is now able to detect smaller earthquakes. Location of earthquakes is also going to improve a great deal, so automatic location of earthquakes is going to improve a great deal in this area. This means that more earthquakes are going to be visible on Icelandic Met Office maps then before.

Hi Jón, thanks for this information, hope they’ll begin posting soon, so we will have more info and Lurking will have more fodder for his figures.
Hi Jón,
Cool, more toys feeding us data. Let’s hope they read this blog and become motivated to make the data freely available.
4.7 EQ near Jan Mayen
Some interesting deeper quakes migrating from western edge of Myrda to NW rim of Katla, once showing at 24.8 km, although -0.5. This definately shows a pattern now.
The next several months could get interesting there.
That earthquake has extremely poor quality. So the location is most likely wrong or this might be a false earthquake (frost quake).
You can view tremor plot Rjupnafell (rju) from all IMO seismic stations.
And the Rjupnafell (RFEL) GPS here http://notendur.hi.is/runa/eyja_gps.html
The earthquakes that are appearing around Eyjafjallajökull volcano are interesting. But I am looking at earthquakes with higher quality then 50.00 when I look at the earthquake list.
Yes, the quakes are getting pretty shallow.
Jon, is there a better site for viewing these quakes other than IMO. The IMO site listed below does not allow one to see the data for each quake circle on the map such that you can’t correlate the map with the table listing. In your new post re: quakes in Eyja, I only see quakes all around the perimeter of Myrda and Eyja (not right near Eyja) that have increased in quantity which I assume is related to the new SIL seismometers. Sorry if I missed earlier links provided for better quake viewing sites.
Taking into account the new SIL seismometers, is EQ activity picking up, especially for deeper quakes? Thanks 🙂
Are you referring to the quakes
http://en.vedur.is/earthquakes-and-volcanism/earthquakes/myrdalsjokull/#view=map
And… an FYI.
“Technology skew.” With the new sensors there will be more data, which means fewer quakes will be overlooked. When the count goes up for this area, keep that in mind. It doesn’t mean its bad, just that there is more and that someone looking at it should keep that in mind. That especially applies to us. The professionals already know this.
And… over the last few days I have still been trying to get the quakes in and around Grímsvötn wrangled into a moment tensor plot. Not finding a decent text on the formulas, I have been going through various papers… mainly the ones NOT trying to convince me to do triple integrals. I hit upon a USGS site that listed focal solutions for historical quakes, it had the newton-meter values for the Mw magnitudes. Since the bona-fide conversion from ML to Mw requires taking into consideration the crust in that area… I selected only quakes that were in Iceland, and then tried to time correlate those events to the ML and M values in the SIL list. Some of those events don’t correlate well. Were talking multiple quakes in the SIL list for single events in the USGS one, magnitudes that are no where near the same etc.
I have noted that the M value in the SIL list is the one that usually appears on the MET site. So, for the S&G aspect of it, I plotted those two against each other. The results looked like the correction plots that ISC uses for it’s unified magnitude conversions for the different seismic networks.
http://www.isc.ac.uk/help/search/custom/magmu.html
So… I beginning to think that the M value on the MET site (and in the lists) is the already converted Mw that I have been looking for.
And.. this is where I get really odd results.
This plot is the one that I’m trying to reproduce… my plot should come out pretty close to it if I ever succeed.
http://hraun.vedur.is/ja/vatnajokulsvoktun/grf_uppsafn.html
MY version plot has a really large jump on the 1st of November 2004. The rest of the turns and over all shape seem correct… except for that huge jump.
Looking at the raw data (well, the data in the listings), there seems to have been a nasty swarm at Grímsvötn at about that time. Lots of Mag 3+ events. I can see where that would be expected from a volcano just coming off an eruptive phase…. but what is with the data?
Does SIL clump them into some bit bucket or ignore them in its plot? I dunno. But that’s four times that I’ve pursued this and come up short. I’m open for ideas.
So the mass of quakes currently shown round Eyjafjallajokull are just because of better monitoring? or have the extra seismometers coincided with a real earthquake swarm????
I think most of them would also be recognized with old equipment, only the small and negative quakes are now able to be recorded.
Quite a few are small or negative, but it is still difficult to know how small would have been missed before. I am suspecting that there is a real swarm though. How long have the extra seismometers been planned of have they been put in quickly in response to expecting a swarm? Does anyone here know?
Yes, there should be and uptick in smaller quakes.
As is noted in a following thread (the new one), the number of larger events should be about the same. This will likely show up in a time vs number events plot at a later date.
This is a guess… but I’m thinking that the skew at Mag 1.1 and higher should be minimal.
i always check the earthquakes in Iceland…
and to my surprise there were a great many this morning.
Well, i thought, Jon will be able to explain what’s going on…
And You did.
Thanks for the great blog and timely information.
Best!motsfo
Wednesday
05.01.2011 01:39:22 63.627 -19.792 1.0 km -0.7 99.0 9.8 km E of Seljalandsfoss
😀
The measuring scale for earthquakes is logarithmic – what also allows negative values.
… Waiting for one with magnitude < – 1.0 😀