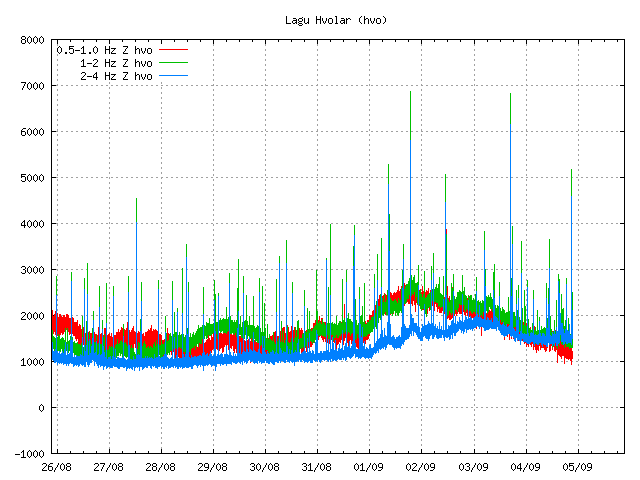
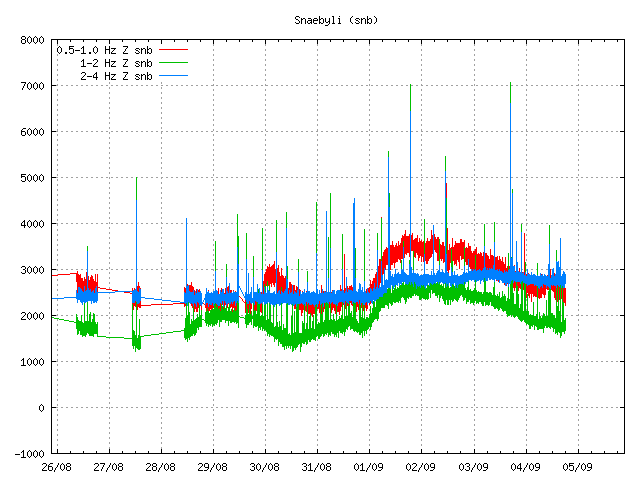
This has become almost a daily occurrence. But today there was one harmonic tremor spike (at least) in Katla volcano. It is unclear why this harmonic tremor spikes happen in Katla volcano. But they often do happen just before a earthquake swarm starts, but often several hours before (sometimes). I am not sure why that is. But one idea is that this activity is connected to hydrothermal areas that are under the Mýrdalsjökull glacier.
Earthquake activity has been quiet in Katla volcano today. But it is hard to know for sure if that is going to last. As earthquake activity appears to be on the rise in Katla volcano during the whole of the year 2011 according to news in Iceland (see earlier blog post for details).

Harmonic tremor spike as seen on Lágu Hvolar SIL station. The spike is between 04/09 and 05/09. The spike is a small top in the tremor chart (hard to spot). Copyright of this picture belongs to Iceland Met Office.

Harmonic tremor spike as seen on Snæbýli SIL station. The spike is between 04/09 and 05/09. The spike is the broad band that suddenly appears in the tremor data. It is easier to see then on Lágu Hvolar. Please note that it seems that Snæbýli SIL station has gone offline again, as it has stopped updating. Copyright of this picture belongs to Iceland Met Office.
It is clear that Katla volcano is going for a eruption. But the question remains is just when that is going to be, but it is impossible to predict when a eruption is going to take place in Katla volcano. But the signs have come clear in my opinion in this matter. For the moment it is just waiting and watching. But this might be a long wait until something happens in Katla volcano.

And speaking of Katla, what can I see on it at the moment? Is it the moon, Aurora Borealis, or evil alien overlords shooting evil lasers at Katla? 😉
There was a nice northern light yesterday but it only started after midnight. So, I guess that was something else.
Did you see this craft?
http://www.youtube.com/watch?v=ixO9thrjPpM
Yet another link from Eyja to Katla.
Heh, cool video! I wonder what that was! 🙂
Flying Sheep?
I remember that at the time, it was a helicopter everybody concluded on Eruptions blog. It was visible on one of the Eyja’ web-cams as a bright light generally flying close to the eruption. For me the question is, did the pilot or crew report their presence to air traffic control and more to the point is there any video/pictures taken from the helicopter for us to look at? I have not seen any footage, don’t know about air traffic, perhaps someone else closer to Eyja’ does.
Slysaalda shows it nicely too.
http://hraun.vedur.is/ja/oroi/sly.gif
True Carl, Jón you should try to capture that picture too, it’s interesting.
The timing seems to fit with an yet to be checked earthquake at 16:59:44 (63.621, -19.353) at 15,8 km depth, 1,2R as shown in Skjálftavefsjá but Slysaalda seems to be showing something else and at a later time than the other 2 mentioned in the beginning
Skjálftavefsjá data:
http://drifandi.vedur.is/skjalftavefsja/identify.jsp?sEQLonRange=&sEQLatRange=&DateTimeRange=2011-9-2 22:43:00;2011-9-4 23:13:00&MagnitudeRange=0.0;6.0&DepthRange=0.0;100.0&Coords=&mapPosX=63.4969849651981&mapPosX2=63.7883444052871&mapPosY=-18.6737055220945&mapPosY2=-19.4487216327313&orderby=OTIME&desc=true
There is a connection error on few SIL station. That is the large spike (goes up and down clearly) seen on Slysaalda SIL station.
What do you think is different now from the 1999 activity and it’s seismic increase untill 2002-2003? I’ve become a little sceptical when it comes to Katla, we’ve seen so many signs which could indeed mean an impending eruption, but it could be just as well a repeat of the 1999-2003 period.
From what I can see of the mapped history since 1999 you could well be right, this could be normal activity, take the Godabunga area for instance, apart from 2010 and EJ the rest is normal.
Actually a good question.
The thing that is different though is where the quaking is going on (Austmannsbunga). And the almost forgotten fact that inflation started before the quakeing started to increase according to Sigrún Hreinsdottir.
I am going on holidays in October and November. I really hope that Katla (and also Hekla) wait until December. Anyways, I think it is more interesting is both erupt in combination with Hamarinn in 2012, for giving that year a mystical show.
I am of course joking. I don’t wish for these volcanoes to erupt (well, Hekla if it is small it is a nice show to watch) but the others, no, please no.
20 yrs of earthquake data from 4 Iceland volcanic areas: Katla, Ayja, Torfajokull & Goda .. on a 12, 072 pixel-long plot! …
http://twitpic.com/6g85ri/full
The idea is to be better able to see patterns on one continuous plot, rather than the single year plots shown at http://hraun.vedur.is/ja/myr/myr_mag.html#img
It is interesting to view the plot with different degrees of size compression, which is easily done with a free viewer such as irfanview or ms paint.
Some observations:
In 2002 Katla showed a lare number of earthquakes, but did not have an eruption.
Gola shows a very strong seasonality pattern in the occurance of its quakes! (Why?)
The magnitude distribution for the earthquakes in the four regions appears to be remarkably different. For Katla and Eyja, the magnitude distribution appears to follow more of a gaussian, bell-shaped profile. Whereas the magnitude distributions for Goda and Torfajokull appear to have sharp cutoff at a maximum intensity. Since there is debate as to whether Goda-area quakes are ice-quakes or magma-related quakes, I wonder if the intensity distribution profiles (histograms) can indicate whether the quakes are more likely to be ice-quakes as opposed to magma-related quakes.
In particular, it would be interesting to analyse quakes at shallow levels within the Katla Caldera (such that they *must* be ice-quakes) and see if their intensity (magnitude) distribution has a characteristic profile (sharp cutoff at high intensity?) which is similar to Goda’s profile of intensity distribution but dissimilar for deeper Katla quakes, which must be magma-related.
The idea is to establish whether ice-quakes can be identified by their intensity distribution, and then, if so, to compare the profiles (histograms) to the intensity distribution of Goda-area quakes, in order to see if the Goda-area quakes match an ice-quake profile or a magma-related quake profile.
That was illuminating and beautiful to scroll through. Thank you.
Could I humbly ask if someone could add/highlight eruptions? Maybe known eruptions like Eyja in one colour and suspected, like Katla 99/03 in a fainter one.
Thank You to Jon for this wonderful blog and the holistic community around it who make it a great place to lurk and learn.
Carl’s youtube link for cornstarch (previous post) reminded me of art I have seen created from sound waves from basic notes i.e. vowels like ‘Ahhhh’ that are shared across many cultures. It was a simple experiment with sand and paper if I recall, but the sounds always formed the same patterns. I can’t remember any links but will try to find. I can also visualise some experiments at school; a green screen and a sound wave appearing (shakes head as he remembers how science was unfortunately not taught by enthusiastic teachers who made the subject live).
What does this have to do with volcanoes and mantle etc? Before I lurked I would have said nothing, but now I am beginning to understand waves and visualise them. Long, short, slow, fast they move, sound and look different but patterns do emerge. The sound that I ‘saw’ represented by the sand art or on the cornflour covered speaker is a vibration, or at least a visual manifestation of it. A heartbeat can be seen, heard or felt. An earthquake, tectonic or magmatic is also a vibration and it’s movement through a medium, can be seen, heard and felt (depending on sensitivity of human/machine/animal). It’s all about frequency. Until I read this blog I could never visualise the two acting in harmony (or was that harmonic?), even though it is staring in the face obvious. Who knows what the patterns represent, if the similarities mean something or not, all I know is they look beautiful. Mother Earth has some serious (geological) basslines 😉
I’m Craig by the way and I am going to bed now where I should have been hours ago. I blame Katla. Be safe everyone.
Thank You BVH 🙂
Most interesting.I too think it would be a good idea to separate Ice and magmatic quakes.
Just glancing Torfajokull. It seems to have a pattern all of it’s own and seasonal. How deep is the Ice covers this volcano? I cannot see any real relationship between Torfajokull and the others but then I think I would need a lot more information.
One other question here to anyone.
Has the equipment changed since the beginning of the plots? Are they more sensitive for instance, as this could make a big difference in interpreting these graphs.
Scientists have already stated that Katla is preparing and has been preparing for an eruption since year 2000
Must admit I just didn’t see 19/20th of your graph yesterday, must have been tired.
TBVH:
Really nice plot.
First of all, those that areas that you have marked as question-marks. They are most likely periods that the system have been down. They are quite simply to total.
Second, Erik Klemetti and Boris Behncke have written quite a lot on ice-quakes. They state that proper Icequakes are very shallow indeed. But, they have also stated that as glacier ice melts the shift in weight influence volcanos down to a greter depth then the icequakes do. But, Godabungas majority of quakes are tectonic/magmatic, but the relief of pressure from the melting ice might “provoke” them into existence.
Third, you are quite right to ask the question about 2002, why did it not erupt then, and why might it erupt now? Darned if anyone knows. But, we now have a point of interest in Austmannsbunga that is new. Also general inflation is far higher now then at that period. Time will tell.
Fourth, it is quite fun to see how even Torfajökull is in it’s activity, but with a very minute upgoing trend.
Fifth, the Godabunga had a four year long quake swarm startin in 2001, running up into very late later part of 2004.
And finally, back to Katla. Something changed in her in 2001. Between 1991 and 2001 she was about as lazy as Torfajökull in creating quakes. She slightly more quakes, and they where mainly above 1,5, but they where not many really. Then in 2001 the pace picked up and in 2002. But all of a sudden the quakes are on a general level smaller then before. The activity thinned out a bit in 2005, and the quakes stayed smaller then pre-2001, then in 2008 the quakes started to get more numerous again.
Things are hopping on Katla now. Three EQ’s across the caldera with a dozen or so older EQ’s scattered about. I wonder if we are seeing a series of dike emplacements under the volcano and, if so, when all that magma will find the mush of rhyollite sitting there.
2011-09-05 07:19:10.0
16min ago 58.90 N 31.53 W 80 mb 4.8 REYKJANES RIDGE 2011-09-05 07:30
2011-09-05 07:16:01.0
19min ago 59.10 N 30.45 W 100 mb 4.5 REYKJANES RIDGE 2011-09-05 07:33
2011-09-05 05:44:08.0
1hr 51min ago 59.14 N 30.86 W 10 mb 4.6 REYKJANES RIDGE 2011-09-05 07:20
2011-09-05 05:05:37.0
2hr 29min ago 59.16 N 30.89 W 10 mb 4.9 REYKJANES RIDGE
Great minds Dull! was about to post – EMSC showing these, only one appears to be shown on IMO – os that because they are too far away?
Just cross checked myself. I’ve no idea why IMO shows something different.
Recent earthquakes south of Iceland
2011-09-05 07:19:10.0
16min ago 58.90 N 31.53 W 80 mb 4.8 REYKJANES RIDGE 2011-09-05 07:30
2011-09-05 07:16:01.0
19min ago 59.10 N 30.45 W 100 mb 4.5 REYKJANES RIDGE 2011-09-05 07:33
2011-09-05 05:44:08.0
1hr 51min ago 59.14 N 30.86 W 10 mb 4.6 REYKJANES RIDGE 2011-09-05 07:20
2011-09-05 05:05:37.0
2hr 29min ago 59.16 N 30.89 W 10 mb 4.9 REYKJANES RIDGE
violet circle in the upper left corner
http://www.emsc-csem.org/#4
http://www.emsc-csem.org/Images/EVID/23/234/234630/234630.wide.seismicity.jpg
I like that picture – where do you get that from on the EMSC site?
http://www.emsc-csem.org/#4
click on the row bellow the map you wont to see and then click on “seismicity”
Thanks Jarin!
not at all; of course want(wont) 🙂
this one wasn´t so deep…
http://www.emsc-csem.org/Images/EVID/23/234/234615/234615.wide.seismicity.jpg
MAR earthquakes (south of Iceland) are usually followed by activity in SW Iceland. Well see, what happens in the coming weeks…
New blog post is up! 🙂
Powerful earthquake swarm event…Is Katla erupting right now?