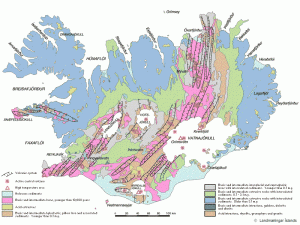
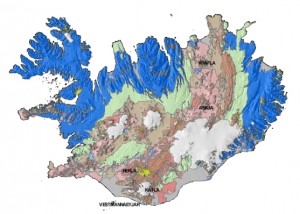
Here are two maps of the geology in Iceland. The first map shows the fault zones with the active volcanoes in Iceland. Also in this map the age of the rock is shown. The second map shows the rock type, if it is acid, basic and so on.

A map of Iceland with fault zones and active volcanoes. This map is not up to date with newest research and stuff like that. Click on the picture to get a full size.


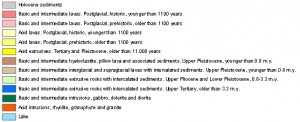
This map shows rock type in Iceland. Explanation is to the right. Click on the picture to get a full size.
Both pictures are from this web site here.


Thank you Jón!
Just what I need 🙂
What’s up with that Herðubreiðartögl / Upptyppingar region? 3rd Mag 3+ in just a few days.
’tis shaking. Do one of your beautiful plots on the area and we’ll all know more.
I have been watching the IMO earthquake page for a few years now. On one of my searches on there site I found a link to projects they were participating in. One of those was the VOLUME project. It is a project sponsored by the EU. It’s intended purpose is to identify precursors to eruptions. Here is the projects homepage http://www.volume-project.net. What I found was a paper on the Icelandic contribution to this project. Its main focus was Eyjafjallajökull but they included Upptyppingar since it was having a considerable swarm right smack in the middle of the period the project was to run for. I have just had a look at the projects site and found these in there publications list:
Jakobsdóttir, S.S., M.J. Roberts, G.B. Guðmundsson, H. Geirsson, and R. Slunga, 2008, Earthquake swarms at Upptyppingar, North-east Iceland: a sign of magma intrusion? Studia Geophysica et Geodaetica, 52, 513–528.
Geirsson H., Sigmundsson F., Ofeigsson B. G., Sturkell E., Arnadottir T., Hooper A., Einarsson P., Gudmundsson G., Jackson M. and Blume F., Crustal deformation associated with the deep-seated seismic swarm at Upptyppingar, north of Vatnajökull, Iceland IAVCEI- 2008 General Assembly, Reykjavik-Iceland, 17-22 August 2008.
Hooper A. and Pedersen R., Deformation at Katla, Eyjafjallajökull and Upptyppingar, Iceland, from Multi-Temporal InSAR: A Combined Persistent Scatterer and Small Baseline Method, IAVCEI- 2008 General Assembly, Reykjavik-Iceland, 17-22 August 2008.
Unfortunately I don’t have access to their publications nor links to where they can be found.
To cut a long story short, from what I remember from reading the IMO’s contribution regarding Upptyppingar was that there were two distinct episodes of earthquake swarms with the first one having the main focus at about 11 to 14 km depth and the second about 6 to 7 km depth. I must emphasize this is from memory because I can’t find my download from that time. What they hypothesized that these earthquakes represented magma rising.
Anyhow I thought this might put recent earthquakes in that region in perspective.
http://www.springerlink.com/content/q9274tj322410621/
This is the abstract for the Stud Geoph Geod paper you found. Search engines will often find abstracts given the article source, but articles usually behind pay-walls.
Interesting the EQs in the 2007 swarm were much deeper ,14-22km, than now. Upptyppingar is about 12km SE of the epicentre of current EQs.
I did… but it’s in the other thread “New Geophone station…” since that was where every one was at. (I didn’t catch that until after my post here)
Right now it’s sitting in the “got to make sure you are not spam since you put so many links in your post” que.
It’s a plot of all quakes there from November until about 20 minutes ago.
Okay… now that my password issue has been resolved.
The other post (in the other thread) with the plot links is here:
http://icelandgeology.net/?p=281&cpage=1#comment-3357
@Jon:
There have been some recent quakes (e.g. yesterday and today) near Langjökull, Torfajökull and Hekla. I guess you have seen them on your geophones. Does the signature look like magmatic or tectonic for these quakes?
This where just tectonic earthquakes far as I was able to tell by there wave form. But I do wonder if the earthquakes close to Hekla where pre-sequence earthquakes to a eruption, in short of indirect way.
One small M0.9 eq at Krysuvik at depth of 0,7 km, quality 90%.
Interesting report on EQ swarm at Askja / Upptyppingar/ Herdubriedartogl in 2007 here:
http://gef.nerc.ac.uk/documents/publications/842.pdf
Fig 1 are 2006 EQs
Fig2 are 2007 EQs
My initial impression is we are seeing a repeat of the green spots of Fig2, both in terms of location and depth.
It would be fascinating to see the same plot for present swarm
Eh… it’s close. Not perfect, but close.
http://i52.tinypic.com/2s5z09l.png
O don’t have one for just November and December, the auto scale for a range extending 30 km depth keeps messing up the fit between the three plots. I’m gonna have to think about that one a bit… lest I get frustrated.
More info on Askja EQs from here:
http://publications.esc.cam.ac.uk:8080/706/
and:
http://www.esc.cam.ac.uk/people/research-students/janet-key
It seems the 14-26km deep EQs are significant- too deep to be in brittle crust, and middle crust is aseismic. Deep EQs may reflect magma melt moving through the hot lower crust; putatively the result of high strain rates at tips of propagating dykes.
Lurking,
Fascinating plot, thank you.
I am trying to visualise and compare the two – alcohol’s a bit of a hindrance – so I imagine the right panel being folded down, and the lower panel too , to give two sides to a cube….
The linear feature on your plot at 65d 5’N and -16d 27′ W ( the green ‘dyke’ extending to near surface down to 5km) aligns with a similar linear feature in the 2007 data. Your plot hints at three more linear near vertical ‘dykes’ to the east: in 2007 striping in the image was not visible amongt the dense array of EQs.
Your plot shows a dramatic absence of EQs at Upptyppingar ( big patch of blue spots in 2007 at around 15km depth).
Likewise we dont see the deep EQs (15-25km) depicted in brown. Maybe we need more time – the deep EQs were relatively rare in 2007.
On other hand the isolated patch just east of the lake Oskuvatn ( 65d2’N -16d40′) is seen on both plots at the same 3-5km depth, despite the absence of deeper EQs ( brown in 2007).
So whats happening? With almost no deep (15-25km) EQS compared with 2007 I find it diificult to envisage rising magma as triggering these rather shallow EQs. At Eyjaf the sequence was clearly deep EQs progressing shallower over a few weeks. Could it be that at Ask/Upp/Herd the magma intrusion detected as the deep EQs in 2007 is only now triggering shallower EQs?
Peter
Lurking,
I am really struggling with the orientation of the sloped intrusion described in the Hooper etal paper:
http://radar.tudelft.nl/~ahooper/Hooper_et_al_ALOS_2008.pdf
The problem is with fig 6 right hand panel, a vertical section supposedly viewed from SWW. I have no probem with the left panel: the EQs in plan make a dumbell shape within the square and correspond to the brown EQs deep under Askja ( left half of dumbell) and the shallower green EQs near Herdubreid. But I cannot get the right hand panel to fit, unless vertical section were viewed from NW ( 315deg)- not SWW(245deg) which the authors give in the legend. So I’ll follow the data and trust my own eyes.
So maybe the swarm of shallow EQs we are seeing this year are the result of magma rising up that sloping intrusion? – from deep under Aska rising up and north-eastwards at roughly 45 degrees inclination to hit the surface where your spots are focussed into a sharp line. Coordinates: 65,5’N -16,27’W. That’s on the western slope of Herdubreidartogl. towards its soutern end. Just a guess!
Well, I too have been guilty of making plots that no one can understand.
I’ve annotated that figure to help a little.
The view angle of the left hand panel is as if you are looking at the feature end on. In the right panel, I’ve drawn an arrow showing where the view in the left hand panel is positioned. I think that the red box indicates the area that is shown in the left panel… at least that’s what makes sense to me.
I’ve labeled the 25 km horizontal measure is show on both panels.
http://i54.tinypic.com/900jdz.png
BTW, I’ve noticed some tilt to the apparent fault plane of our recent quakes (last two months) but haven’t really figured out how to best represent it.
Lurking: your plots are great and I’m trying to follow Peter’s reasoning. Fascinating.
There are few new earthquakes in Esjufjöll volcano. Due to good weather I did manage to record two of them poorly.
@Peter: Very curious about what you are inferring here. You said “Deep EQs may reflect magma melt moving through the hot lower crust; putatively the result of high strain rates at tips of propagating dykes.” If I understood it correctly, I wonder if growing amounts of magma melts couldn’t be forcing tips of dykes to shake by pressure, yet they aren’t brittle enough to be detected at those depths, as they did in 2007. That means melting processes may be rising unnoticed.
Or, in other words: do we expect to see deeper EQs right now? Or they just can no longer be felt?
The tilting described by Lurking could be reflecting this kind of stress, even though we don’t get deep earthquakes evidence that they’re doing so.
If what I said is mere stupidity, just go on with the good work.
Many thanks.
I’m thinking that the influx of magma/melt as determined from the study (which had their own seismos in place, augmenting the permanent SIL network) is seeping up along the paths if previous dikes and/or structural weakness caused by tectonic motion. I believe that is what Mr. Cobbold is infering… that it took three years or so for the intruded melt/ magma to start displacing material and causing fractures at the ends of the emplacement as the finally fatigues and cracks.
That is, if that is what is going on. Remember that Jón noted that these things predominantly have a tectonic look about them. That is also a highly likely circumstance. There trillions (quadrillions?) of cubic kilometers of rock jostling around on either side of this region… you know, the North American and the European plates.
The temporary equipment that the study had used has long since been retrieved and gone elsewhere. All we have left to mull over are the quakes as reported by the permanent network. Without an expert looking at the fine grain data that it provided… we might not get an answer until something pops open a crack and starts spewing stuff. Either that or it will go a way and we will just sit here puzzled.
I have made a new post about ongoing earthquake swarms in Iceland.