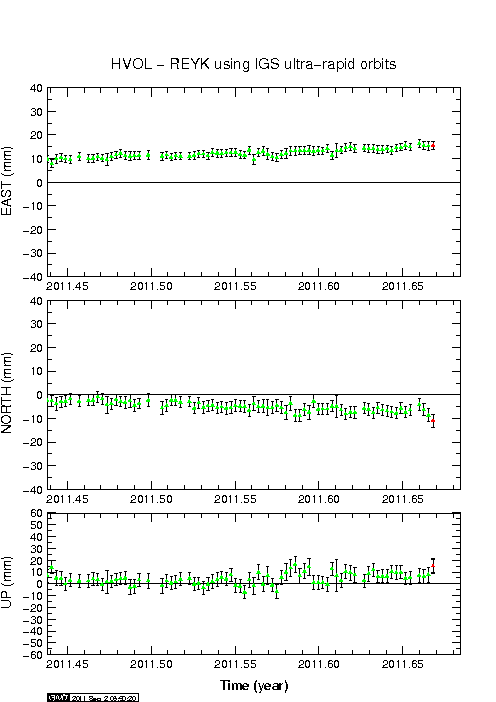
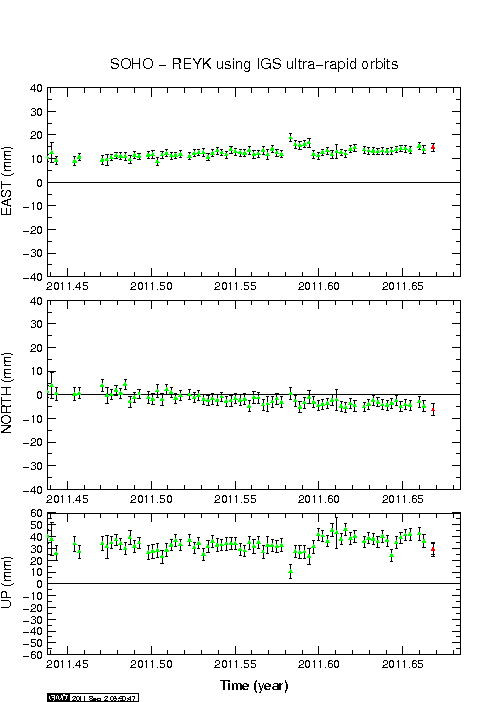
Today (3. September 2011) at 16:45 UTC a earthquake swarm did start in Katla volcano. So far this earthquake swarm has been small, with the largest earthquake just with the size ML2.7 at the depth of 1.1 km (automatic data). But the quality of this earthquake was good, so location is accurate from what I can tell.
I am not sure at this moment if there is a harmonic tremor spike following this earthquake swarm or not. As the earthquakes are long period due the fact that they are created by magma movement in Katla volcano. This might be dike intrusion. But for the moment it is hard to know that for sure.

The area of earthquake activity today in Katla volcano. Copyright of this picture belongs to Iceland Met Office.
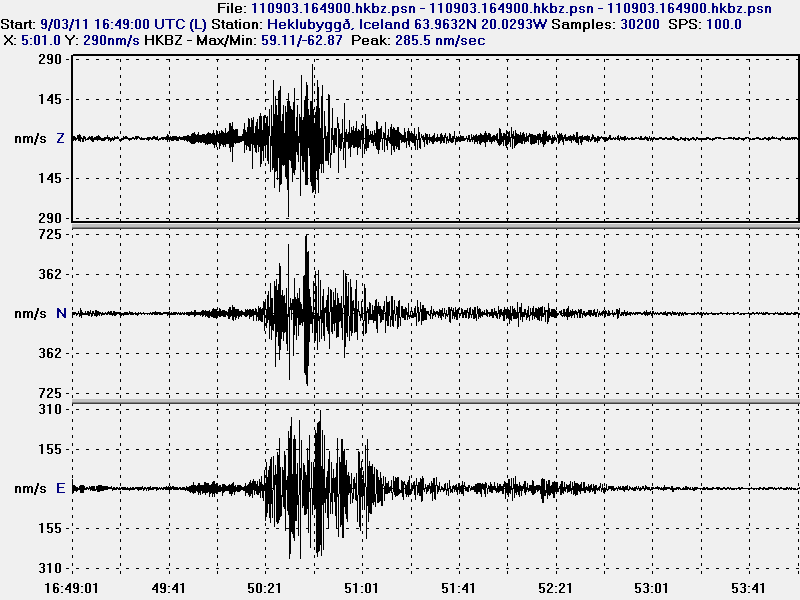
The ML2.7 earthquake (automatic size) in Katla volcano caldera. This picture is released under Creative Commons Licence, see Licence web page for more details.
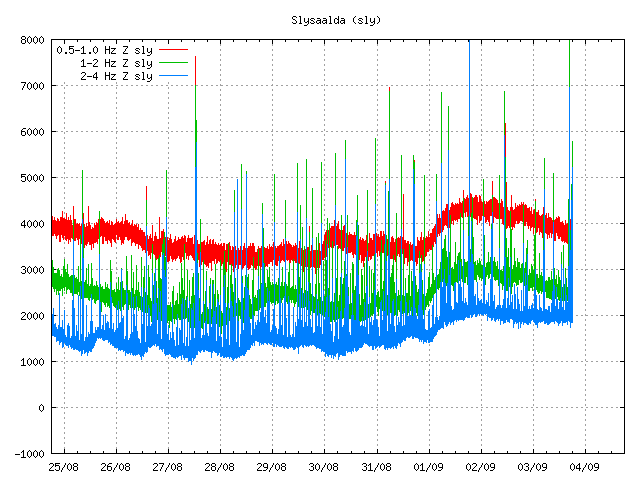
Harmonic tremor plot of the current activity. Latest activity is at the end of the tremor plot. Copyright of this picture belongs to Iceland Met Office.
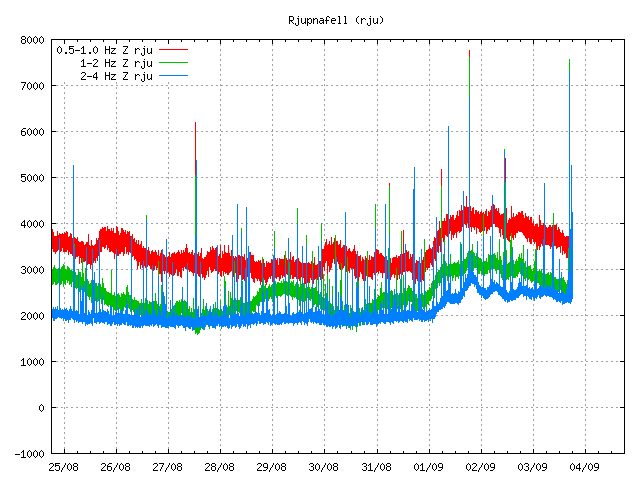
Harmonic tremor plot of the current activity. Latest activity is at the end of the tremor plot. Copyright of this picture belongs to Iceland Met Office.

Harmonic tremor plot of the current activity. Latest activity is at the end of the tremor plot. Copyright of this picture belongs to Iceland Met Office.
I cannot tell at the moment what is going on in Katla volcano. But the earthquakes tell me that the reason why they are happening is because of magma is moving inside Katla volcano. But latest data (not shown here) do however show that no harmonic tremor is currently ongoing, if it ever started during this earthquake swarm. I am expecting the earthquake swarm to continue and last for the next few hours. But I must point out that that is what might happen, as sometimes earthquake swarms just stop when you think that they might be about to start for real.
