During the night (and when I had unstable power) there was a small glacier flood from Mýrdalsjökull volcano. Some minor harmonic tremor change was detected following this glacier flood. This even was small one, many times smaller then what did happen on the 8 to 9 July 2011. Due to security concerns the Civil Emergency Authority did close the main road in Iceland for this area. Since they never know how big the flood can actually be. The main road was closed for about one hour. This glacier flood was detected around midnight 20 to 21 July 2011.
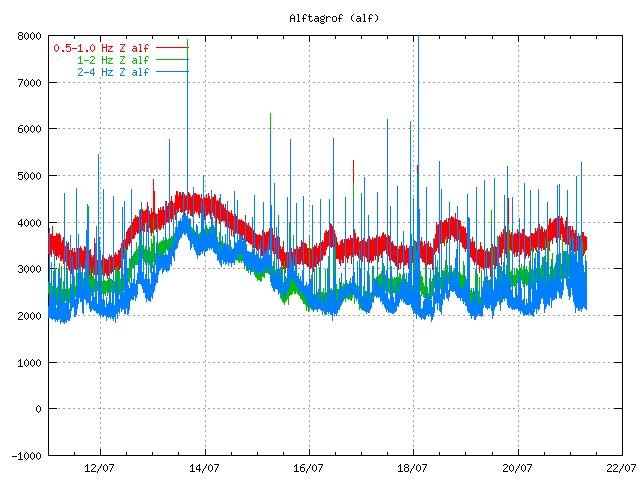
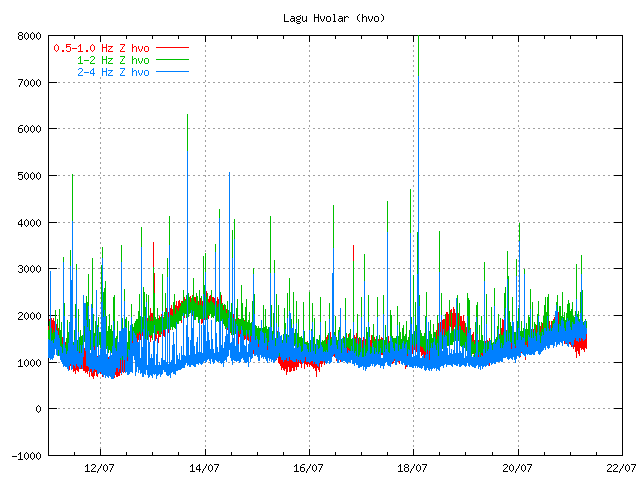
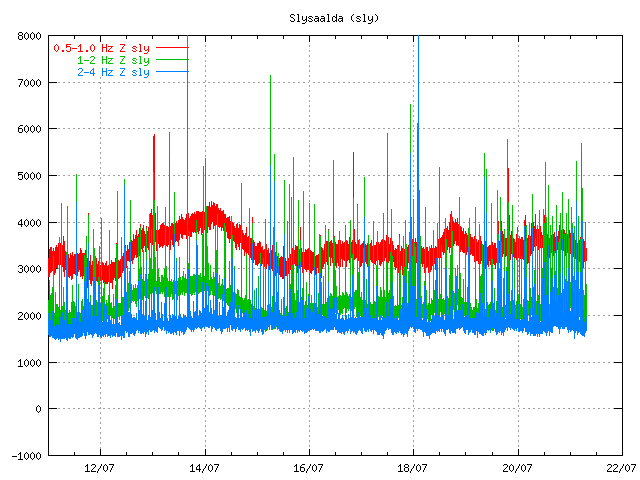
This flood is actually so small it is hard to see it on the harmonic tremor plot from the SIL stations around Katla volcano.

Tremor plot from 07:50 UTC this morning. It is hard to see the harmonic tremor from this minor glacier flood. Copyright of this image belongs to Icelandic Met Office.

Tremor plot from 07:50 UTC this morning. It is hard to see the harmonic tremor from this minor glacier flood. Copyright of this image belongs to Icelandic Met Office.

Tremor plot from 07:50 UTC this morning. It is hard to see the harmonic tremor from this minor glacier flood. Copyright of this image belongs to Icelandic Met Office.
What happens next is impossible to know for now. But it seems that activity continues to be high in Katla volcano. All that can be done is to wait and see what happens. But I am going to continue to monitor the changes in Katla volcano as best that I can do until I finish my summer job (29. July).
Icelandic News about this.
Aukin leiðni í Múlakvísl og órói í Mýrdalsjökli (Vísir.is, Icelandic)
Náið fylgst með Mýrdalsjökli (mbl.is, Icelandic)
Hringvegurinn opinn á ný (Rúv.is, Icelandic)
Breytingar í Múlakvísl (Rúv.is, Icelandic)

Jon,
Can you direct me to a post that will explain, or better still, briefly explain yourself, how to read the tremor plots. For example, some specific questions I have are;
the 0.5 -1.0 hz (red) plot is normally around 2000 +/- 1000 on most plots, yet at Krisuvik it is 4000+, in fact all are much higher generally at Krisuvik. Why is this so?
Additionally, why is the green band, generally above the red band at Crjothals (gha)?
regards
@ Doug
I too am still learning
I found this link very helpful.
http://qvsdata.wordpress.com/learning-links/understanding-seismograms-and-earthquakes/
I applied the knowledge I gained from there to the IMO graphs. I also read many of the older posts here concerning MONITORING.
If you go down to the bottom right of this page you will find a list of categories. Here you will find lots of explanations of occurrences that happen and their interpretation as regards Iceland geology.
I am not sure why sometimes the three coloured bands exchange places. I assumed that it was when wind or water “noise” was exceptional., if there was say many heavy breaking waves, those tremors would be picked up by a SIL station a little away from the coast. As most of the SIL stations are in fairly remote areas motorised traffic is mostly not the cause of most tremors.
Earthquakes are shown by a definite tall “spike”.
If the three coloured bands all suddenly move up and in frequency together (in harmony!) this suggests that some tremors are occurring in the one area. Such as the movement of magma beneath the SIL or a very large, sudden, glacial movement or flood near the SIL.
I am sure someone more knowledgeable than myself will put us right if my amateurish explanation is wrong or inadequate.
I hope this will help. I have found this Blog a steady learning curve. I learn a little more each day.
See this post for info on harmonic tremor …
http://icelandgeology.net/?p=84
Personally, I question the usefulness of the simplistic three-frequency-band detectors. Are they used much outside of Iceland? If not, why not?
Have not found out exactly what equipment and software there using, but it appears that they are focusing on the low frequency coda waves in the 0.5 to 2.0Hz, and looking for shallow lithosphere S waves, unfortunately this also picks up lots of P wave background noise from the ocean/ocean wind. Possibly concentrating on a narrow band width, targeting magma flow and crustal deformation or they are just not publishing data from other band widths.
http://www.agu.org/journals/ABS/1975/JB080i023p03322.shtml
[PDF] High-frequency P-wave seismic noise driven by ocean winds
@Doug down South, I do not know this system my self. But I believe that -1000 is silence of close to it.
I am not into how the systems of Icelandic Met Office works in details. I can read some of them (tremor plots). But that is just because they are available on-line and have been for a long time now.
Another question regarding the tremorcharts. What is the amplitude measured in? Is it a “real” value or is it just a set value to keep track of the trending? In many charts its listed between -1000 up to 8000. Are those values representative of something?
And @ Diana. You wrote If the three coloured bands all suddenly move up and in frequency together (in harmony!) this suggests that some tremors are occurring in the one area.
I believe that is also a very clear indication of crappy weather. Strong winds make all the bands increase in amplitude.
As I have seen most often when the tremor increases due to magmatic movements the bands widen. This is until the eruption itself let loose and the bands shoot up like they did during the jökulhlaup except they will shoot higher.
Thanks Daniel, your reply is appreciated.
I think that to us novices the most difficult thing to recognise on IMO tremor graphs are harmonic tremors.
I shall keep practising and learning. I am sure when one of the Volcanoes decides to erupt the changes will be hard to miss!!
I certainly saw the changes in readings caused by the last biggish jökulhlaup.
@Fonix just read the article and this is exactly what should be termed scaremongering rubbish.
Any group specifically engineering their name to produce an acronym ICECAP has a political agenda not a scientific one. The article, as is usual with this sort of stuff is full over half truths, appearing to make a scientific discovery! In reality basically rubbish to justify a political intent. No peer reviewed material quoted or referred too.
These comments don’t reflect my attitudes to global climate change as a whole just to people who try and manipulate science to their on ends!
There is no doubt that eruptions can affect the global climate. A real bonus of the climate change debate is that far more money and result is being allocated to this research. There is some excellent work being done on the eruption last summer with some surprising, non biased results. I’ll dig up the links and post them.
The article Fönix cited is also over a year old, with no follow-up to indicate whether or not the La Niña trended as suggested.
Here is a link to one of the more recent studies, based on the Eyjafjallajökull event. It sounds interesting, but this is just the abstract, and you would have to pay to get the entire article:
http://www.pnas.org/content/early/2011/06/30/1104923108.abstract
I read the article i cited a year ago because i was wondering if we were underestimating the possibilities of climate change resulted by volcanos, i think there are some useful points in the article, We have now had 3 eruptions in Iceland since April 2010, 2 of them produced considerable amounts of volcanic material.
As i see it, it would be smart to expect at least one more eruption in the near future.
Thanks for the link.
This video is from Hvolsvöllur, during the Eyjafjallajökull eruption.
http://visir.is/oskurigning-a-hvolsvelli—myndskeid/article/2010952570074
@diana and daniel,
Many thanks for your response and the links, which I shall use as a resource. Hopefully, someone can still address my specific questions about these particular icelandic tremor graph locations.
Cheers
@daniel_swe
Don’t know if you’ve seen this page but gives locations for all seismometers in Iceland and very brief intro to monitors explaining the absolute value of the scale has no meaning and is arbitrary.
@ doug down south.
If you think of the frequencies as an audible noise, high pitch, like birds singing, medium pitch kids playing in a park, and low pitch like a base drum.
Now visualise what a graph would look like in a park on a quiet day with no one around and only a few birds. All three bands fairly steady with the odd peak in the high pitch (high frequency band) .
Now visualise kids come park and scare of birds, high pitch returns to little activity while mid- pitch goes up, one of the kids brings a drum with them so what does the plot do etc etc.
So the important aspect of the graphs are the ‘normal plots’ which take into account the ‘normal background noise’ this will vary from location to location, what causes the local noise can only really be identified by local investigation. Once you ‘see’ the normal you can then spot the abnormal and try to identify it. (and that’s a whole new story).
Different frequencies also travel at different speeds through the substrate, (and different speeds through different substrates) so if you know the geology of the area, the time difference between each peak (same event) you can calculate have far from the instrument the anomaly occurred, if there are several station s picking up the event you can triangulate the event to give its location and depth.
Hope this helps, hope I have not over simplified it too much.
Sorry page did not go through, here it is
http://hraun.vedur.is/ja/oroi/allarsort.html
@mitch,
Thanks, that explains the location differences very well. I guess that Krisuvik is just a generally noisy place. This does answer my questions.
Thanks to you and others who have responded.
Mitch, thanks for the explanation. Really helps.
Imagen del Volcán Popocatépetl – webcam- http://www.cenapred.unam.mx/popo/UltimaImagenVolcanI.html
More than 570 quakes so far in El Hierro…
El Hierro webcam – http://laspuntas.myipcamera.com:1024/img/main.cgi?next_file=main.htm
Looking back at the EQ charts for Katla in recent weeks, their locations have migrated slowly around the caldera from being mainly in the south to being mainly in the north and then back to the south again. Perhaps there is even a slight suggestion of an anti-clockwise movement of EQs around the caldera. Is there any significance to this slow movement of EQ concentrations around the caldera and back or is this just normal behaviour for Katla?
What would be nice to see is a time scale animation of the EQ’s at Katla going back a few months. If anyone has the data and ability to put something like this together.
M 6 in Mt Pinatubo! Andy Logan
@Andykins101 Andy Logan
Guys the epicnter was at near Subic whre half of Pinatubo is,the water at the crater turned brown,dati hue tinged dw.lakas lindol sa Angeles
vor 18 Minuten via Twitter for BlackBerry®
RhenzBryan: RT @ARANoid: RT @juansuing: Remember that the 1990 Luzon earthquake triggered the Pinatubo eruption in 1991. Scary. – SCAAARY as hell!
about 1 hour ago via ÜberSocial for BlackBerry · Reply · View Tweet
jwlangeles: RT @ruffybiazon: Epicenter is supposedly near San marcelino town in Zambales, SW of Pinatubo
5.9 2011/07/25 17:15:41 14.970 120.119 35.0 LUZON, PHILIPPINES
Is over 30 km from Pinatubo. Near the subduction zone.
Nothing to worry about.
New blog post is up! 🙂